- Google Looker Studio
How To Fix Conflicting Metrics In Looker Studio Reports
02 Jul 2026
Looker Studio dashboards are meant to make reporting easier. But when the same report shows different numbers for the same metric, trust disappears quickly.
A Looker Studio data discrepancy usually happens when the data source, filters, date range, blended data, calculated fields, aggregation functions, connector credentials or data freshness are not aligned. In many cases, the issue is not the dashboard design. The issue sits inside the reporting setup, data modelling, connector configuration or source platform.
To fix Data discrepancies in Looker Studio, teams should first compare the report against the original Analytics source, then check the date range, data source, filters, Data Blending, calculated fields, aggregation rules, connector credentials and data freshness.
For marketing managers, the analytics team and CEOs, conflicting metrics are not just dashboard issues. They affect campaign decisions, budget allocation, measurement clarity and business performance conversations.
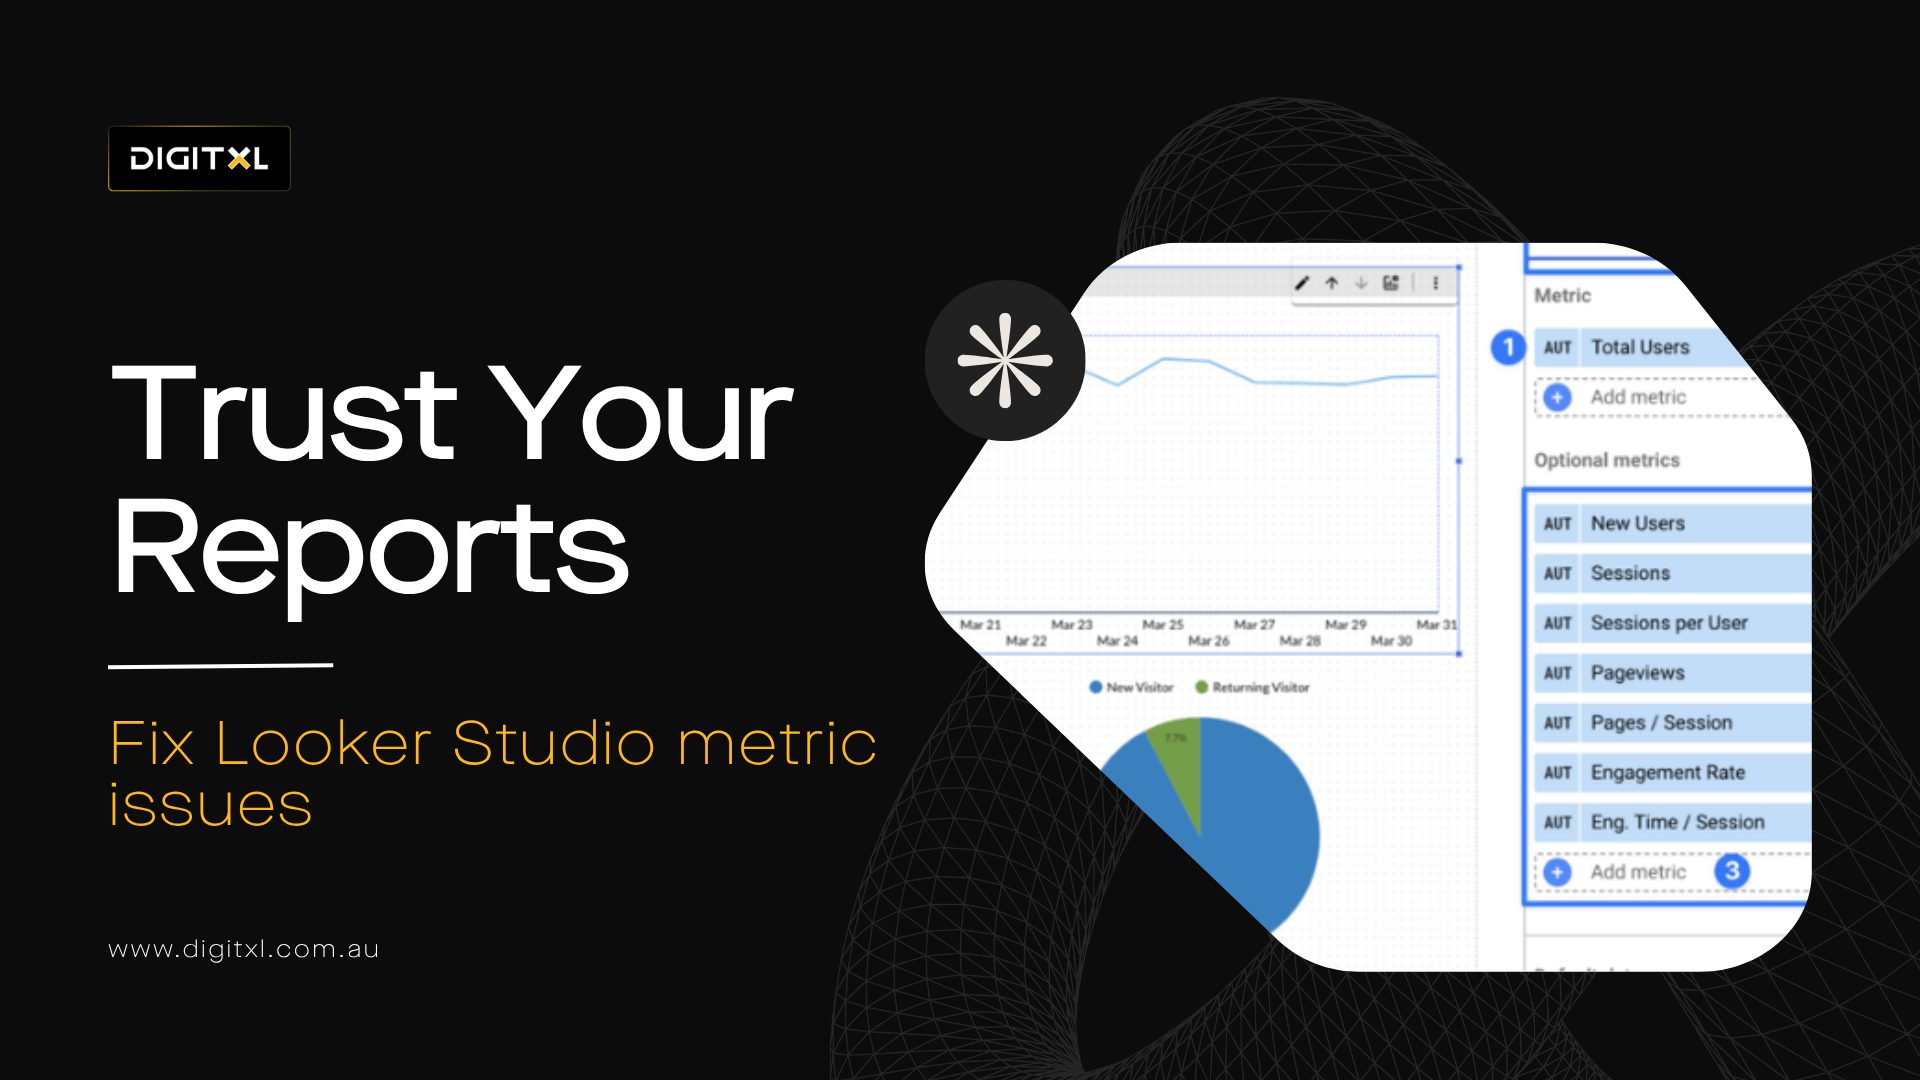
1. What Are Conflicting Metrics In Looker Studio?
Conflicting metrics in Looker Studio happen when the same metric appears differently across charts, pages, scorecards, tables or Data sources.
For example:
- A scorecard shows 1,200 leads, but a table shows 1,050 leads.
- Revenue in Looker Studio does not match Google Analytics 4, Shopify or CRM data.
- Google Ads spend is duplicated after Data Blending.
- A calculated conversion rate changes across charts.
- The same campaign has different clicks, page views, sessions or conversions depending on the connector.
- A report shows a data set configuration error instead of returning results.
- A Search Console table does not match Google Search Console source data.
- A GA4 Data Source shows different Total Users, Active Users or Bounce Rate depending on the selected dimension.
This is why many teams ask: how do you fix a Looker Studio data discrepancy before sharing reports with stakeholders?
The answer is to find where the mismatch starts: the source platform, connector, data source, Data blend, filter, calculated field, aggregation rule, chart configuration or user interface setting.
2. Why Looker Studio Data Discrepancies Happen
Looker Studio does not always create the discrepancy. In many cases, it exposes problems that already exist in the reporting setup.
2.1 Different Data Sources Define Metrics Differently
A Google Analytics connector, GA4 Data Source, Google Ads connector, BigQuery table, Google Sheets file, SQL Server database, Search Console connector, CRM export or ecommerce platform may define the same metric differently.
For example, Universal Analytics, a UA Analytics profile and a GA4 Analytics profile will not always align because they use different measurement models, user definitions and Event Processing logic.
2.2 Different Date Ranges Change Results
One chart may use the report date range while another uses a custom chart-level date range. Period comparison settings can also make numbers appear inconsistent.
2.3 Filters Are Not Applied Consistently
A report-level filter, page-level filter, group-level filter or chart-level filter may apply to one visual but not another.
2.4 Blended Data Is Duplicating Rows
Incorrect Join methods can multiply spend, clicks, leads, conversions, page views or revenue. Data Blending is useful, but weak join keys and field mappings can create misleading totals.
2.5 Calculated Fields Are Built Differently
One chart may use a report-level calculated field while another uses a data-source-level calculated field. The same metric name may have different logic behind it.
2.6 Aggregation Rules Are Incorrect
Metrics may be summed, averaged, counted or counted distinctly in ways that change the result. Incorrect aggregation functions are a common reason conversion rate, Bounce Rate and User Stickiness Metrics do not match.
2.7 Connector Or Credential Issues Exist
A custom connector, Supermetrics API connection, Default DS Google Analytics connector, Data API connection or third-party data connector may lose access, fail to refresh or return incomplete data.
2.8 Data Freshness Is Delayed
The dashboard may show older data than the original platform. This is common when data comes from a data warehouse, Google Sheets, SQL Server, third-party APIs or scheduled exports.
2.9 Schema Mismatches Break Fields
Schema mismatches happen when a field is renamed, removed, changed or typed differently in the source system. This can cause charts, formulas or field mappings to fail.
3. What To Check First When Looker Studio Metrics Do Not Match
Before rebuilding a report, start with the basics.
3.1 Check The Source Platform
Compare the Looker Studio metric with the original platform, such as Google Analytics, Google Analytics 4, Google Ads, Facebook Ads, Meta Ads, Search Console, Google Search Console, BigQuery, Shopify, CRM or the original data source.
3.2 Check The Date Range
Confirm whether all charts are using the same date range, conversion date and comparison period.
3.3 Check The Data Source
Make sure charts are pulling from the intended connector, GA4 Data Source, Search Console source, Google Sheets file, SQL Server table, Power BI extract or data warehouse.
3.4 Check Filters
Review report-level, page-level, group-level and chart-level filters.
3.5 Check Blended Data
Review Join methods, join keys, field mappings and the granularity of each table inside the Data blend.
3.6 Check Calculated Fields
Confirm whether formulas are consistent and not double-counting values.
3.7 Check Aggregation
Review whether each metric is summed, averaged, counted, counted distinctly or calculated correctly.
3.8 Check Data Freshness
Confirm when the source data last refreshed and whether the connector has processed the latest data output.
3.9 Check Credentials
Make sure the connector still has permission to access the data. This is especially important when using API credentials, Supermetrics API, Google Ads, Search Console, Ads Business Manager, Pinterest Ads, Facebook Ads or Meta Ads.
3.10 Check Metric Definitions
Agree on what each metric means before reporting it to leadership.
4. How To Fix Looker Studio Data Discrepancy
5. Compare Against The Source Platform
Start by checking the source of truth.
If the report uses Google Analytics, compare the metric against Google Analytics. If it uses Google Analytics 4, compare it against GA4. If it uses Google Ads, compare it against Google Ads. If it uses Search Console, compare it against Google Search Console. If it uses BigQuery, run the query directly in the data warehouse. If it uses a CRM, compare against the CRM report.
This helps identify whether the mismatch comes from Looker Studio, the data source, the connector or the original platform.
For example, if GA4 revenue and Looker Studio revenue match, but Shopify revenue is different, the issue may be attribution settings, refunds, tax, shipping, time zone differences or transaction processing rather than Looker Studio itself.
6. Check Date Range And Time Zone Settings
Date range differences are one of the simplest causes of Looker Studio metric conflicts.
A report may have a default date range, but individual charts can use their own custom date ranges. A scorecard may show the last 30 days while a table shows this month. A period comparison may also change the way values appear.
Make sure every chart uses the intended date range before investigating deeper issues.
Also check whether different platforms use different time zones. Google Analytics 4, Google Ads, Facebook Ads, Meta Ads, CRM systems and ecommerce platforms may not align perfectly by day if their time zones are different.
7. Day Of Week And WEEKDAY Formula Issues
Some dashboards use Day of Week logic, a WEEKDAY formula or Manual calculation to group performance by weekday. If the report uses inconsistent date formats, the weekday logic may return incorrect values.
This can affect time series charts, campaign reports and traffic channels reporting.
8. Review Filters Across The Report
Filters can be applied at several levels in Looker Studio:
- Report level
- Page level
- Group level
- Chart level
- Data source level
A metric mismatch can happen when one chart has a filter that another chart does not. For example, a table may exclude internal traffic while a scorecard includes it. A page may filter by country, but one chart may override that filter.
Filters can also create issues when a regex rule is used differently across charts. A regex rule may group traffic sources, landing pages, campaign names or domain names in a way that changes the final number.
Review filters carefully and document which filters are intended for each section of the report.
9. Check Data Source Configuration
Data source configuration issues can cause missing, incorrect or unavailable metrics.
This is especially relevant when users ask: how do you fix a data set configuration error in Looker Studio?
A data set configuration error may occur when a field is missing, a connector loses access, credentials expire, a schema changes, a calculated field breaks or the report expects a field that no longer exists.
To fix this, review the data source connection, refresh fields, check credentials, confirm field types and make sure the connector still has permission to access the data.
If the error appeared after changes in GA4, BigQuery, Google Sheets, SQL Server, a third-party custom connector, CRM export or administration system, the report may need to be updated to match the new data structure.
10. Fix Blended Data Problems
Blended data is one of the most common causes of conflicting metrics in Looker Studio reports.
Blends are useful when combining Data sources such as GA4, Google Ads, Meta Ads, Facebook Ads, Search Console, CRM data, Google Sheets and BigQuery tables. But if the join keys are wrong, the blend can duplicate rows, remove records or inflate totals.
For example, joining Google Ads campaign data with GA4 session data only by campaign name can cause duplication if the same campaign name appears across multiple dates, traffic sources, traffic channels or accounts.
Better join keys may include:
- Date
- Campaign ID
- Campaign name
- Source
- Medium
- Account ID
- Landing page
- Transaction ID
- Customer ID
- Domain name
- Search query
- Conversion date
The right join key depends on the reporting question. Always test blended totals against the original sources before using them in executive dashboards.
10.1 Data Blend And Cardinal Row Issues
A cardinal row problem happens when one row in one source joins to multiple rows in another source. This can inflate metrics such as page views, Total Users, conversions, cost or revenue.
Before publishing the dashboard, check whether the blend is working at the right grain.
11. Review Calculated Fields
Calculated fields can create discrepancies when formulas are inconsistent.
For example, one chart may calculate conversion rate as:
Conversions / Sessions
Another may calculate it as:
Transactions / Total Users
Both may be called “conversion rate”, but they answer different questions.
Other issues happen when calculated fields mix aggregated and non-aggregated fields, use different filters or apply formulas after blending data.
To fix this, create a metric dictionary that defines each calculated field, formula, data source and intended use. Use consistent naming so stakeholders understand what each metric means.
11.1 Common Calculated Field Problems
Common problems include:
- Incorrect aggregation functions
- Incorrect date formats
- Incorrect regex rule logic
- Manual calculation errors
- Fields coming from the wrong data source
- Formula logic that changes after Data Blending
- Custom dimension values being treated as metrics
- Custom events being counted more than once
12. Check Aggregation Rules
Looker Studio metrics depend heavily on aggregation.
Some fields should be summed, such as spend, revenue, impressions and clicks. Others may need to be counted, counted distinctly, averaged or calculated as a ratio.
Incorrect aggregation can create misleading results. For example, summing conversion rates across campaigns is usually wrong. The correct approach is often to calculate total conversions divided by total sessions or clicks.
Aggregation issues can also affect Active Users, Total Users, User Stickiness Metrics, Bounce Rate, conversion rate and custom events.
Review each metric’s aggregation setting and confirm whether it matches the business definition.
13. Validate Joins And Data Granularity
Granularity means the level of detail in the data.
A daily campaign table, a user-level CRM table, a search query table, a Google Search Console export and an event-level GA4 export all have different levels of granularity. If these are combined incorrectly, numbers can multiply.
For example, one campaign row may join to many conversion rows. If spend is repeated across those conversion rows, total cost becomes inflated.
Before building dashboards, analysts should check the grain of each data source and decide whether the report needs campaign-level, session-level, user-level, transaction-level, search query-level or date-level reporting.
13.1 Bloom Filters And Large Dataset Logic
For large reporting systems, bloom filters may be used in the data warehouse or data modelling layer to support matching, filtering or deduplication logic. If this logic is poorly implemented upstream, Looker Studio may display confusing data output.
14. Check Data Freshness And Refresh Issues
Sometimes Looker Studio reports do not match source platforms because the data has not updated yet.
A connector may refresh on a delay. A Google Sheet may not have updated. A BigQuery table may depend on a scheduled query. A third-party connector may have API usage quota limits, pagination parameters or sync issues.
If numbers look wrong, check when the data last refreshed and whether the source platform has also finished processing the data.
14.1 Browser Cache Issues
Browser cache can also make a report appear outdated. Before assuming the data source is broken, refresh the report, clear browser cache or test the dashboard in another browser.
15. Create A Reporting Governance Layer
The best way to prevent recurring Looker Studio data mismatch issues is to create reporting governance.
This means defining:
- Source of truth for each metric
- Metric definitions
- Data sources used
- Data refresh schedule
- Filter rules
- Channel grouping rules
- Blending rules
- Calculated field logic
- Data modelling ownership
- Dashboard ownership
- QA process before publishing
- Measurement clarity standards
This reduces confusion and gives stakeholders confidence in the report.
16. Looker Studio, Data Studio And BI Platform Considerations
Looker Studio has gone through naming changes over time. Some teams still refer to it as Data Studio, Google Data Studio or Google Looker Studio. The reporting issue is usually the same: the dashboard needs clean, trusted and consistently modelled data.
Looker Studio is often used for marketing reporting because it has strong visualisation capabilities, a relatively simple user interface and easy connections to Google Analytics, Google Analytics 4, Google Ads, Search Console and Google Sheets.
However, larger teams may also use Power BI, a BI platform connected to a data warehouse, or a custom reporting stack. The same principles still apply: the data source, metric definitions, joins and calculated fields must be consistent.
17. Common Connector Issues In Looker Studio
Connector issues are a common reason for data mismatches.
17.1 Default DS Google Analytics Connector
The Default DS Google Analytics connector may behave differently depending on whether it is connected to Universal Analytics, a UA Analytics profile, a GA4 Analytics profile or a GA4 Data Source.
17.2 GA4 Data Source
A GA4 Data Source can show differences because Google Analytics 4 uses event-based measurement. Metrics such as page views, Active Users, Total Users, Bounce Rate, custom events and user interactions need to be interpreted carefully.
17.3 Google Ads Connector
The Google Ads connector may use different attribution settings, conversion date logic or conversion definitions compared with GA4 or CRM data.
17.4 Search Console Connector
The Search Console connector may show search query, organic search, domain property, domain name and SEO reporting data differently depending on the selected property type.
17.5 Custom Connector
A custom connector may return different results if API usage quota limits, pagination parameters, schema mismatches, field mappings or credential settings are not configured properly.
17.6 Supermetrics API
The Supermetrics API can be useful for Facebook Ads, Meta Ads, Pinterest Ads, Google Ads and other marketing platforms, but data output must still be validated against the source platform.
18. SEO Reporting And Search Console Data Issues
SEO reporting often relies on Google Search Console, Google Analytics 4 and Looker Studio.
A Search Performance chart may look different from Search Console if filters, dimensions, date ranges or property types are not aligned.
18.1 Common SEO Reporting Mismatches
Common mismatches include:
- Domain property vs URL-prefix property differences
- Search query filters not matching
- Organic search data not aligned with Google Analytics 4
- Search volume data from Google Keyword Planner being compared with Search Console impressions
- Landing page URLs not matching due to domain name or URL formatting
- Google Search Console data being blended incorrectly with GA4 data
Google Keyword Planner, Search Console and GA4 answer different questions, so they should not be treated as identical data sources.
19. GA4, Google Tag Manager And Event Processing Issues
Google Analytics 4 data in Looker Studio depends on how events are collected, processed and reported.
19.1 Google Tag Manager
Google Tag Manager can affect reporting if tags fire incorrectly, custom events are duplicated, user actions are missed or custom dimension values are not populated correctly.
19.2 Event Processing
Event Processing delays can create temporary differences between Google Analytics 4 and Looker Studio. Some metrics may not be final immediately.
19.3 Conversion Data
Conversion Data may differ depending on conversion settings, attribution settings, conversion date, consent mode, tag firing and how conversions are defined.
19.4 Customer Journey Reporting
Customer journey reporting may differ between GA4, Google Ads and CRM systems because each platform uses different attribution logic and processing rules.
20. Data Preview Dashboard And QA Process
Before publishing an executive dashboard, teams should create a data preview dashboard.
A data preview dashboard helps the analytics team validate data output before stakeholders see the report.
20.1 What To Include In A Data Preview Dashboard
A useful data preview dashboard should include:
- Source platform comparison
- Date range checks
- Data source checks
- Filter checks
- Blend checks
- Calculated fields
- Aggregation functions
- Time zone comparison
- Sample rows
- Data freshness
- API status
- Connector status
- Conversion Data validation
This makes QA faster and helps prevent reporting issues before the dashboard goes live.
21. Examples Of Platform-Specific Data Discrepancies
21.1 Google Analytics 4 Vs Looker Studio
GA4 and Looker Studio may differ because of Event Processing, custom dimension configuration, attribution settings, user definitions, Active Users, Total Users and reporting thresholds.
21.2 Google Ads Vs Looker Studio
Google Ads may differ because of conversion date, attribution settings, click-based reporting, delayed conversions or account-level configuration.
21.3 Search Console Vs Looker Studio
Google Search Console may differ when the wrong property is selected, the domain property does not match, filters are different or search query data is blended with another source.
21.4 Google Sheets Vs Looker Studio
Google Sheets may differ if rows are updated manually, formulas are broken, date formats are inconsistent or the sheet has not refreshed.
21.5 Facebook Ads And Meta Ads Vs Looker Studio
Facebook Ads and Meta Ads data can differ because of Ads Business Manager settings, attribution windows, API sync delays, currency differences or campaign naming changes.
21.6 SQL Server Vs Looker Studio
SQL Server data may differ if the query logic, date field, aggregation level or data refresh schedule does not match the report definition.
21.7 Power BI Vs Looker Studio
Power BI and Looker Studio may not match if each BI platform uses different data modelling, relationships, transformations, filters or refresh timing.
21.8 Proton Mail, Proton VPN And Tropical Server Examples
Some businesses use tools such as Proton Mail, Proton VPN or Tropical Server as part of their broader administration system, security setup or hosting environment. These tools are not typical Looker Studio data sources, but they can still affect reporting workflows if access, authentication, IP restrictions or server-side data exports are involved.
22. What Marketing Managers, Analysts And CEOs Should Review
Marketing managers should review whether the report reflects how campaigns are planned and managed. They should confirm that traffic sources, traffic channels, campaign, audience and conversion definitions match marketing reality.
Analysts should review connectors, Data sources, filters, calculated fields, Data blend setup, joins, aggregation functions, data freshness, source validation and data modelling. Their role is to identify where the mismatch begins.
CEOs and leadership teams should focus on trust. If the same dashboard shows conflicting numbers, it cannot support budget, revenue or growth decisions. The key question is not whether the dashboard looks good. The key question is whether the numbers can be trusted.
23. When To Work With A Looker Studio Agency Or Consulting Partner
You should consider working with a Looker Studio agency or Looker Studio consulting partner when reporting issues involve multiple platforms, blended data, broken connectors, complex calculated fields or stakeholder trust problems.
A practical Looker Studio consulting approach can help teams:
- Audit existing dashboards
- Fix Looker Studio data discrepancy issues
- Resolve data mismatch issues in Looker Studio
- Review data source configuration errors
- Validate connectors and credentials
- Clean calculated fields
- Fix Data Blending joins
- Improve dashboard performance
- Create metric definitions
- Build trusted executive reports
- Review Google Analytics and GA4 reporting
- Validate Google Ads and Search Console reporting
- Build a data preview dashboard
- Improve measurement clarity
- Support data warehouse or BI platform reporting
This helps teams move from confusing reports to dashboards that support better decisions.
24. Final Thoughts
Conflicting metrics in Looker Studio reports usually happen when Data sources, filters, blends, calculated fields, aggregation functions, connector settings or metric definitions are not aligned.
To fix data mismatch issues in Looker Studio, start with the source platform, then check date ranges, filters, data source configuration, blended data, calculated fields, aggregation and data freshness.
The goal is not just to make the dashboard look cleaner. The goal is to make reporting trustworthy.
When Looker Studio reports are properly configured, marketing managers can optimise campaigns faster, analysts can explain performance with confidence and CEOs can make better decisions about revenue, budget and growth.
25. FAQs
Q. How Do You Fix Looker Studio Data Discrepancy?
A. To fix a Looker Studio data discrepancy, compare the report against the original source platform, check date ranges, review filters, validate the data source configuration, inspect blended data, review calculated fields, check aggregation rules and confirm data freshness.
Q. How Do You Fix Data Mismatch Issues In Looker Studio?
Start by identifying which chart, scorecard or table is showing the mismatch. Then compare the metric with the source platform and review the chart’s data source, filters, date range, calculated fields, Data blend settings and aggregation rules.
Q. Why Do Metrics Not Match In Looker Studio?
A. Metrics may not match in Looker Studio because charts use different Data sources, filters, date ranges, calculated fields, blended data, aggregation settings or connector refresh schedules. Differences can also come from how GA4, Google Ads, CRM or ecommerce platforms define the same metric.
Q. How Do You Fix A Data Set Configuration Error In Looker Studio?
A. To fix a data set configuration error in Looker Studio, check the data source connection, refresh fields, review credentials, confirm permissions, check field types and update any broken calculated fields or charts that rely on missing fields.
Q. Can Blended Data Cause Metric Discrepancies In Looker Studio?
A. Yes. Blended data can cause discrepancies when Join methods are incorrect or when Data sources have different levels of granularity. This can duplicate or remove rows, which affects spend, clicks, leads, conversions and revenue.
Q. Why Does Looker Studio Revenue Not Match GA4 Or Shopify?
A. Looker Studio revenue may not match GA4 or Shopify because of attribution settings, time zone differences, refunds, tax, shipping, transaction processing, delayed imports, duplicate transactions or different source definitions. Teams should agree on a source of truth before reporting.
Q. Why Does Looker Studio Show Different Numbers Across Charts?
A. Looker Studio can show different numbers across charts when each chart uses different filters, date ranges, Data sources, chart-level settings, calculated fields or aggregation rules. Each chart should be checked individually before assuming the data source is wrong.
Q. Should You Clean Data In Looker Studio Or BigQuery?
A. Simple filters and calculated fields can be handled in Looker Studio, but complex cleaning, joining, deduplication and transformation should usually happen in BigQuery, SQL Server, a data warehouse or another data layer before the data reaches the dashboard.
Q. Why Does Search Console Data Not Match Looker Studio?
A. Search Console data may not match Looker Studio if the wrong domain property is selected, filters are different, date ranges are not aligned, search query data is limited or Google Search Console data is blended incorrectly with another source.
Q. Why Does GA4 Data Not Match Looker Studio?
A. GA4 data may not match Looker Studio because of Event Processing delays, attribution settings, custom dimension configuration, reporting thresholds, consent mode, user definitions or differences between Active Users and Total Users.
Q. How Do You Prevent Future Looker Studio Reporting Issues?
A. To prevent future reporting issues, create clear metric definitions, document Data sources, standardise filters, review blended data, use consistent calculated fields, monitor refresh schedules and complete QA before sharing dashboards with stakeholders.
Q. When Should You Work With A Looker Studio Agency Or Consulting Partner?
A. You should work with a Looker Studio agency or consulting partner when dashboard issues involve multiple Data sources, blended data, conflicting metrics, broken connectors, complex calculations or reports that stakeholders no longer trust.

Recent Posts


Case Studies
Business News Australia
On Track Meals
Suncorp

