- Google Analytics
Why Do Teams Calculate the Same GA4 Metric Differently?
01 Sep 2026
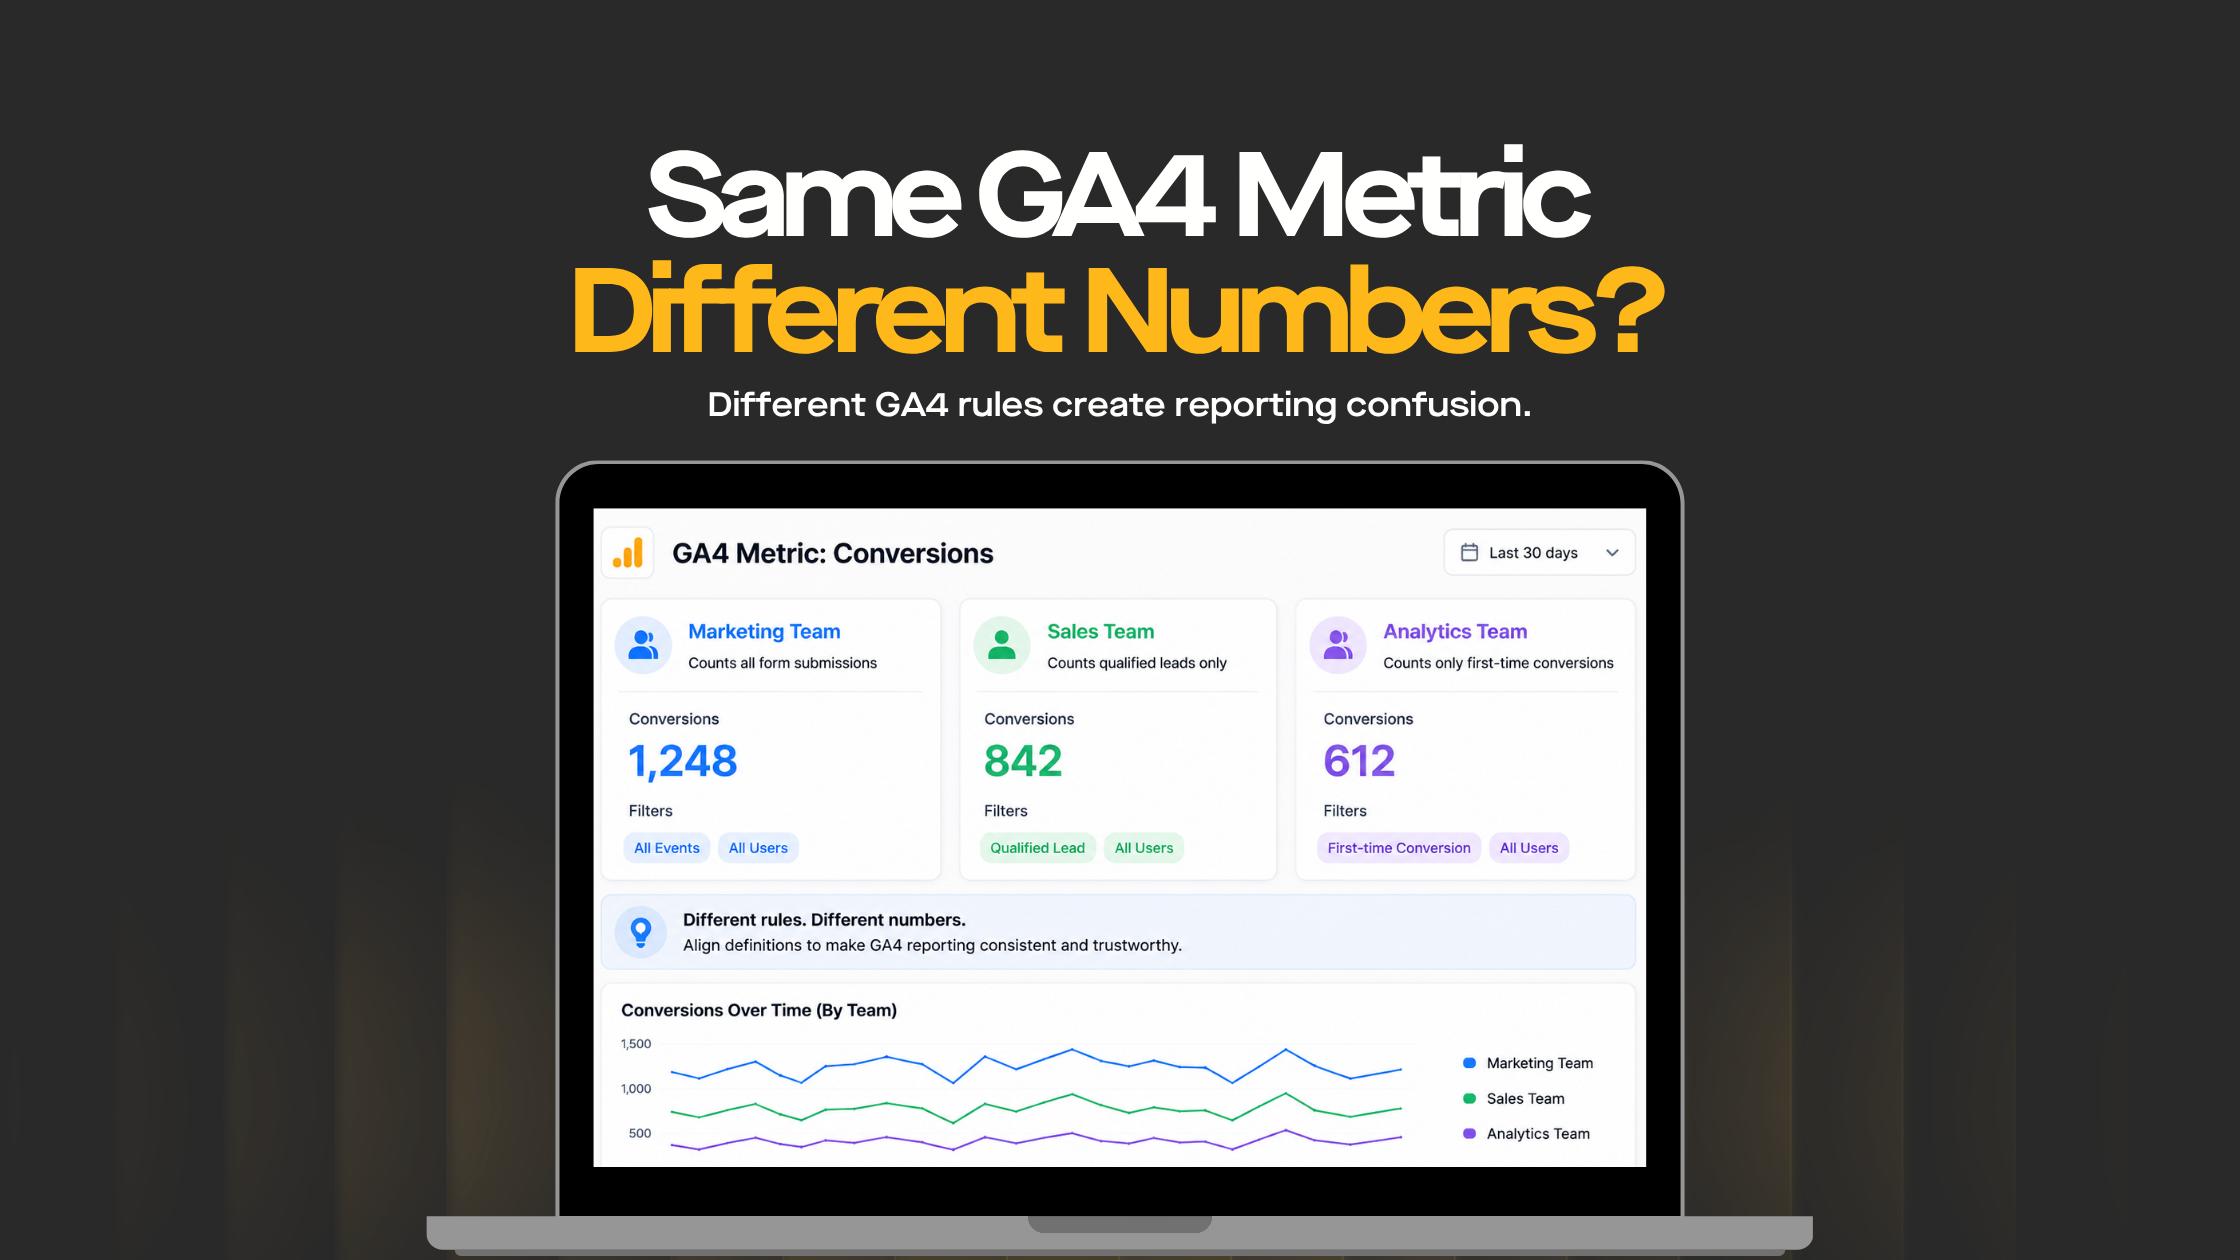
Two people can open the same Google Analytics 4 property, look at what appears to be the same metric and still come back with different numbers.
That does not automatically mean one person is wrong.
The difference may come from the report being used, the dimensions selected, filters, date ranges, attribution settings, user definitions or the way a metric has been recreated in Looker Studio, BigQuery, an API report or another reporting environment.
This is one reason why GA4 numbers look different in Google Reports, even when everyone believes they are looking at the same thing.
For marketing, analytics and digital teams, this becomes more than a reporting inconvenience. If different dashboards show different versions of the same KPI, teams can reach different conclusions about campaign performance, website effectiveness or where budget should be invested.
The real problem starts when marketing, analytics and leadership are using different versions of the same KPI and nobody can clearly explain which definition should guide the decision.
In many cases, this is not a tracking problem first. It is a metric governance problem.
The better question is therefore not simply:
“Which GA4 number is correct?”
It is:
“Are both reports measuring the same business outcome, using the same definition, source and reporting conditions?”
Very often, they are not.
1. Direct Answer: Why Do Teams Calculate the Same GA4 Metric Differently?
Teams can calculate the same GA4 metric differently because the metric name is only one part of the calculation.
The final number can also be influenced by the data source, dimensions, filters, date range, user definition, attribution logic and the formula being used. A conversion rate calculated using sessions will naturally differ from one calculated using users, while a metric recreated in BigQuery, Looker Studio or the GA4 Data API may apply logic that is not identical to the GA4 interface.
Two reports can use the same GA4 metric name and still produce different numbers because the reporting logic behind the metric is different.
When a situation resembles the search phrase “team calculate different ga4 metrics”, the first step should not be to choose whichever dashboard looks more believable. Instead, compare the logic behind each number:
Metric definition → Data source → Dimensions → Filters → Date range → Attribution logic → Calculation method
Once those elements are aligned, most GA4 reporting differences become much easier to explain.
2. Why Can the Same GA4 Metric Show Different Numbers?
One of the most common reporting mistakes is assuming that a familiar metric name automatically tells you how the number was calculated.
It does not.
Take a metric labelled “conversion rate”. One team may define it as:
Website leads ÷ Sessions
Another may calculate:
Converting users ÷ Total users
A third may use GA4’s session key event rate.
All three reports could still contain a metric called “conversion rate”, even though each one is answering a different question.
The same issue can affect metrics such as:
- Users
- Sessions
- Conversions or key events
- Engagement rate
- Revenue
- Average order value
- Lead conversion rate
- Cost per acquisition
- Page views
- Ecommerce metrics
- Custom metrics
The label may look identical while the logic underneath it is completely different.
That is why metric definitions need to be agreed before dashboards are built. If the definition is unclear, the reporting disagreement has already started before anyone begins interpreting performance.
3. Why GA4 Numbers Look Different in Google Reports
GA4 itself can present different numbers depending on where and how a metric is viewed.
A standard Google Analytics report, a GA4 Exploration, an advertising report, an API report and a Looker Studio dashboard may all rely on the same GA4 data, but that does not mean they are using identical reporting conditions.
Differences can come from:
- Dimensions being used
- Filters being applied
- Reporting identity
- Attribution settings
- Calculated fields
- Date ranges
- Data filtering
- Data thresholds
- Custom dimensions
- The way another reporting tool queries or transforms GA4 data
The same principle applies whether teams are analysing web pages, app screens, page views or event-based activity.
A report grouped by Page path may not present the same view as one grouped by Page title, Content group, campaign, source, Page location or Page referrer. The metric may be identical, but the dimension changes how the data is segmented.
Other dimensions can create similar differences, including:
- Screen resolution
- Device model
- Device brand
- Browser version
- Operating system
- OS version
- Audience name
Standard GA4 dimensions and custom dimensions can therefore produce different reporting views even when the underlying metric has not changed.
This is why GA4 numbers look different in Google Reports without automatically meaning that the implementation is broken.
Before changing tags or rebuilding dashboards, it is usually more useful to ask:
What changed between the two reporting contexts?
4. Which GA4 Number Should a Business Actually Use?
This is usually the question teams care about most.
The answer is not that one platform should always be treated as the universal source of truth. The correct source depends on the business question being asked.
If the team wants to understand website sessions or landing-page engagement, GA4 may be the appropriate source. If the KPI is qualified leads, the CRM may be more useful. If the business wants to understand recognised revenue, an ecommerce platform, CRM or financial system may be the better reference.
The stronger approach is to give every important KPI:
One agreed definition, one understood source and one documented calculation.
The right number is not always the one closest to the GA4 interface. It is the number that answers the agreed business question using a reproducible definition.
That distinction prevents teams from comparing metrics that were never designed to represent the same outcome.
5. Why Do GA4 Session and User Numbers Differ Between Reports?
Sessions and users are two areas where apparently simple metrics can become confusing very quickly.
One team may use the Sessions metric directly from GA4, while another recreates sessions from event-level data in a BigQuery export. If the SQL logic, identifiers or aggregation method differ from the reporting logic being used in GA4, the resulting totals may not match exactly.
That difference becomes more important when sessions are used as the denominator for another KPI. If two teams agree that the same number of leads was generated but use different session totals, they will naturally calculate different conversion rates.
User reporting can create similar issues. One report may focus on New users, another on Returning users, while another uses an active user definition.
Even within GA4 reporting, an active user count should not automatically be treated as equivalent to every other user metric. Teams need to know precisely what the active user metric represents and why it is being used.
A report might therefore compare:
New users → Returning users → Active users
while a separate data model uses a first-party user ID or other user-level data.
GA4 can also distinguish engagement through concepts such as an engaged session and user engagement, so a dashboard labelled simply “Users” can hide important differences in how the audience has actually been defined.
The problem is therefore not always the number itself. It is often that the label hides the logic behind it.
6. Why Can Conversion Numbers Differ Even When the Tracking Is Working?
Conversion reporting depends heavily on what the organisation has agreed should count as a meaningful action.
A website might track:
- generate_lead
- form_submit
- book_demo
- contact_us
- phone_click
One team may include all of these in conversion reporting, while another only includes actions that represent stronger commercial intent. The sales team may take a different view again and report only the leads that become qualified in the CRM.
Every report could still contain a metric labelled “Conversions”, but they are clearly not measuring the same stage of the customer journey.
The same issue applies when teams compare the purchase event with other conversion events or use different event-level definitions. GA4 events can contain event parameters that provide additional context, while an event trigger determines when the measurement is sent.
For ecommerce reporting, those differences can extend into fields such as:
- Currency code
- Item affiliation
- Item brand
- Item category 5
- Order coupon
- Product revenue
- In_app_purchase revenue
- Event scopedEcommerce purchase quantity
One dashboard may focus on the number of purchase events, while another reports purchase revenue or total Product revenue. Another may segment those results by Item brand, Item category 5 or Order coupon.
Those measures are related, but they are not interchangeable.
There is also an important distinction between counting events and counting people.
If one user completes the same action twice, GA4 may record two conversion events, while another report records one converting user. A CRM could still contain one contact.
A clearer reporting structure separates those stages:
Conversion events → Converting users → CRM leads → Qualified leads → Opportunities
This makes it much easier for teams to understand what each number represents instead of treating every conversion metric as interchangeable.
7. Reporting Context Can Change the Number Without Changing the Metric Name
Sometimes two teams are using exactly the same metric but applying different reporting conditions.
One report might exclude internal traffic, staging environments or test campaigns, while another includes them. One team might report a full calendar month, while another uses the last 30 days. Timezone differences can also cause activity close to midnight to appear on different reporting dates across platforms.
Common differences include:
- Internal traffic exclusions
- Staging or test environments
- Spam filtering
- Geographic filters
- Date ranges
- Timezone settings
- Device or campaign dimensions
- Operating system
- OS version
- Device model
- Device brand
- Browser version
- Screen resolution
- Audience name
- Search term
- Content ID
- Campaign ID
- Page title
- Page path
- Content group
- Custom dimensions
These GA4 dimensions can materially change how a report is segmented. Adding Page path, Page title, Screen resolution, Device model or Browser version, for example, can create a different view without changing the underlying metric itself.
Values can also be case sensitive in relevant implementations. Inconsistent campaign names, event values, parameter values or custom dimension values can split what the business expected to see as one category into several separate rows.
Both dashboards can still display a metric called “Sessions”, “Users” or “Leads”.
What looks like a calculation problem may therefore simply be a difference in reporting context. For important KPIs, report filters, dates and dimensions should be documented alongside the metric definition so that another person can reproduce the same result.
8. Why Do Channel Numbers Differ Across GA4, CRM and Advertising Platforms?
If the overall conversion total looks reasonable but the channel-level numbers do not match, attribution is often the reason.
Different platforms can assign credit to different points in the same customer journey. GA4 may apply one attribution model, a CRM may retain the original lead source, while Google Ads or another advertising platform may apply its own attribution logic.
The differences can be influenced by:
- Traffic sources
- Marketing channels
- Attribution settings
- Attribution models
- Attribution windows
- UTM parameters
- View-through conversions
- Conversion counting rules
- Campaign ID
- Search term
- Match type
- Ad format
Campaign-level reporting can become even more granular when teams analyse fields such as match type, Ad format, Campaign ID or Search term.
Two reports can therefore show different campaign totals because one is using broad traffic acquisition dimensions while another is using more detailed advertising dimensions.
This does not necessarily mean a conversion has disappeared or been duplicated. The systems may simply be answering different attribution questions.
That is why attribution reporting should only be reconciled after the team understands which model each platform is using and what business question the comparison is supposed to answer.
9. Why Can Looker Studio and GA4 Show Different Numbers?
A Looker Studio dashboard can use GA4 as its underlying source and still display different numbers.
The reason is that Looker Studio may introduce calculated fields, additional filters, blended data sources, custom dimensions or different dimensions.
A dashboard could calculate:
Lead conversion rate = Leads ÷ Sessions
while another calculates:
Lead conversion rate = Leads ÷ Users
Both dashboards may be connected to exactly the same GA4 property, yet the formulas underneath them answer different questions. The issue is therefore not necessarily the data connector or GA4 itself; it may simply be that the KPI has been recreated using different reporting logic.
Teams should also distinguish between standard GA4 metrics and custom metrics created for their own measurement needs. A custom metric can be completely valid, but it should not be presented as though it uses the same logic as a standard GA4 metric unless that has been verified.
The same applies to user metrics and other calculated metrics. If a dashboard uses its own calculation or user definition, the formula needs to be visible rather than hidden behind a generic label.
If a metric is important enough to appear in an executive dashboard, its formula should be documented and reused consistently rather than rebuilt independently every time a new report is created.
10. Why Can BigQuery Numbers Differ From the GA4 Interface?
BigQuery gives analytics teams access to event-level GA4 data and much more flexibility in how metrics are created.
That flexibility is valuable, but it also means analysts can create their own logic for sessions, users, attribution, conversions, ecommerce transactions and channel grouping.
A metric calculated in GA4 BigQuery may therefore not exactly reproduce the GA4 interface unless the SQL logic follows the same definitions and relevant reporting assumptions.
That does not automatically make the BigQuery number wrong. It may simply be answering a different business question because the calculation, aggregation or filtering logic is different.
The BigQuery export is also fundamentally different from consuming an aggregated API report. BigQuery exposes event-level data that teams can transform themselves, whereas the Google Analytics Data API returns reporting data based on the dimensions, metrics, filters and request configuration supplied to the API.
When teams use the GA4 Data API, they should distinguish between the visible metric label in GA4 and its technical API Name. An API report can return a different view depending on the Analytics dimensions, metrics and filters included in the request.
Depending on the report, teams may also encounter technical metric references corresponding to concepts such as:
- MetricsEventEvent count
- MetricsEventKey events
- MetricsPage / screenViews
These should be treated as technical reporting definitions rather than assumed to be interchangeable with custom calculations built from raw event data.
This distinction becomes particularly important when GA4 information is being integrated with external systems such as Salesforce Marketing Cloud, CRM platforms or internal reporting databases.
For any important KPI recreated in BigQuery, teams should document:
Source fields → Transformation logic → Filters → Aggregation → Final calculation
Without this, an organisation can quickly end up with several technically valid but commercially inconsistent versions of the same metric.
11. When Is the Problem Actually the Tracking Setup?
Not every difference comes from reporting logic. Sometimes the underlying measurement itself is inconsistent.
A website may contain multiple tracking codes, Google Tag Manager implementations, plugin-based tracking or server-side tracking. If the same event is sent through more than one path, the reported number can become inflated, while poor tag sequencing can create similar issues if an event fires before the underlying action has actually completed.
For Form tracking, the stronger approach is usually to record a successful lead submission rather than simply tracking a submit-button click. Depending on the implementation, that might mean using a confirmed thank-you page, a platform success callback or a data layer event that fires only after the form has been processed successfully.
The event itself also needs to carry the right parameters. If a purchase event is sent without the expected Currency code, product information or other required event parameters, the event count may appear correct while revenue reporting is incomplete.
The same principle applies to advertising measurement. An ad_impression event and ad revenue represent a different part of the measurement model from website purchases or lead events, so teams should not combine them simply because they appear within the same reporting environment.
The important point is to validate the underlying measurement before spending hours trying to reconcile reporting formulas.
12. How Do Consent and Privacy Affect GA4 Reporting Differences?
Consent can also influence what GA4 is able to observe, although this should be considered as part of the wider measurement environment rather than assumed to be the cause of every reporting difference.
A business may use Consent Mode, Consent Mode v2 or another consent architecture alongside cookie consent banners. Depending on the implementation and the choices users make, analytics and advertising platforms may have different levels of visibility into the same customer journey.
Some visitors may also use ad blockers or privacy-focused browser technology that limits directly observable analytics activity.
Consent configuration can also influence the availability of analytics cookies and the amount of directly observable user-level activity.
Where consent is unavailable, Google may use technologies such as behavioral modeling in eligible configurations to help account for gaps in observable behaviour. This use of machine learning does not mean every GA4 report will automatically match another platform, and teams still need to understand which data is observed, modelled or unavailable.
The organisation’s data retention settings also matter when teams are working with certain user-level or exploratory datasets. A report created today may not always have access to the same historical granularity that another system has retained independently.
The business outcome can still occur even when GA4 has less visibility into it, so reporting differences need to be interpreted within the organisation’s consent and privacy setup rather than automatically being classified as tracking failures.
13. Why Can Google Ads and GA4 Show Different Conversion Numbers?
Comparing GA4 directly with advertising platforms introduces another layer of reporting logic.
Google Ads and other ad platforms use their own conversion measurement and attribution rules. Features such as Enhanced Conversions can improve measurement where appropriately implemented, but they do not mean that Google Ads and GA4 should automatically display identical totals.
Differences can come from attribution windows, view-through conversions, modelling, conversion counting settings, match type, Ad format or the way each platform interprets campaign interactions.
This becomes particularly important when teams use platform-reported numbers to judge campaign performance. Rather than trying to force every platform into the same total, establish which system is intended to answer each performance question.
14. A Practical Way to Diagnose Different GA4 Numbers
When two reports disagree, jumping immediately into Google Tag Manager is rarely the best first step.
A more useful approach is to work through the reporting logic in a consistent order so the team can identify exactly where the numbers begin to separate.
| If the mismatch appears in | Check first |
| Sessions | Filters, dimensions and session logic |
| Users | Active users, New users, Returning users and identity settings |
| Engagement | Engaged session and user engagement definitions |
| Conversion rate | Numerator and denominator |
| Conversion totals | Event trigger, included events and counting method |
| Ecommerce | Purchase event, purchase revenue, Currency code, Order coupon and item parameters |
| Channel performance | Attribution model, UTM logic, match type and attribution windows |
| Page reporting | Page path, Page title, Content group and Page location |
| Device reporting | Device model, Device brand, Screen resolution, OS version and Browser version |
| Looker Studio | Calculated fields, report filters, blends and custom metrics |
| Data API | Requested Analytics dimensions, metrics, filters and API Name |
| BigQuery | SQL logic, aggregation and transformation rules |
| CRM reporting | Lead definition and lifecycle stage |
14.1 Start With the Metric Definition
First, agree on what the KPI actually represents. If one team defines a lead as any successful website enquiry while another only counts CRM-qualified leads, those numbers should not be expected to match.
14.2 Confirm the Data Source and Calculation
Next, identify where each number comes from and how it is calculated. GA4, BigQuery, Looker Studio, CRM platforms and advertising platforms can all apply different logic, so the source needs to be considered alongside the numerator and denominator.
14.3 Review Filters and Reporting Conditions
Once the calculation is understood, compare the filters, date range, timezone and dimensions. Even relatively small configuration differences can create noticeable reporting gaps, particularly in high-volume environments.
14.4 Check Attribution Where Channel Numbers Differ
If the disagreement appears mainly at source, medium or campaign level, review the attribution settings, models and windows before assuming the underlying conversion measurement is wrong.
14.5 Validate the Tracking Last
Finally, confirm that the event itself fires once and at the correct point in the customer journey. If the implementation is duplicated or triggers too early, no amount of reporting reconciliation will make the KPI reliable.
Working through the problem in this order helps teams diagnose the cause rather than changing the measurement setup before they understand what is actually wrong.
15. Build a Metric Dictionary Before Building Another Dashboard
When reports disagree, the instinct is often to create another dashboard that is supposed to become the new source of truth.
That usually treats the symptom rather than the cause.
A stronger starting point is a shared metric dictionary that explains what each important KPI means, where it comes from and how it is calculated.
| Metric | Agreed definition |
| Sessions | GA4 sessions using the agreed reporting logic |
| New users | Users who meet the agreed GA4 new-user definition |
| Active users | Users meeting the agreed active-user definition |
| Engaged sessions | Sessions meeting the agreed engagement criteria |
| Page / screen views | Agreed page and screen viewing metric |
| Website leads | Confirmed successful website enquiries |
| CRM leads | Valid lead records received by the CRM |
| Qualified leads | Leads accepted as commercially relevant |
| Converted leads | Leads that have progressed to the agreed conversion stage |
| Conversion rate | Website leads ÷ GA4 sessions |
| Purchase revenue | Revenue associated with the agreed purchase measurement |
| Product revenue | Revenue attributed to products under the agreed ecommerce logic |
| Ad revenue | Advertising revenue reported under the agreed implementation |
| Opportunity rate | Opportunities ÷ qualified leads |
| Revenue | Agreed CRM or financial-system revenue |
The definitions will naturally vary from one organisation to another, but marketing, analytics, sales and leadership should all understand which version is being used when an important KPI is discussed.
A GA4 metric becomes trustworthy when its definition, source, calculation and filtering rules can be reproduced by someone other than the person who built the report.
16. DIGITXL's Metric Governance Approach
At DIGITXL, we would not begin by trying to force every dashboard to display the same number. We would first understand what each team believes the KPI represents and then work backwards through the data, calculation and reporting conditions until the reason for the difference becomes clear.
Our approach can be summarised as:
Define → Source → Calculate → Filter → Validate → Govern
The first step is to define what the metric means in business terms. Once that is agreed, identify the source that should be used for that KPI and document how the number is calculated, including the numerator, denominator and any important exclusions.
The next step is to make the filters and reporting conditions visible so another analyst can reproduce the same result. The metric should then be validated against the real business journey to make sure a technically correct calculation still represents something commercially useful.
Finally, the definition needs to be governed. Someone should own the KPI so that another team does not recreate the same metric six months later using a slightly different formula and unknowingly introduce another version of the truth.
This does not prevent analysts from exploring data in different ways. It simply means that when the organisation refers to an important KPI, everyone knows what it means, where it comes from, how it was calculated and when it should be used.
17. Measurement Should Support the Decision, Not Just the Dashboard
The reason to resolve reporting disagreements is not simply to make dashboards look cleaner. It is to help teams make better decisions.
GA4 is useful for understanding acquisition, landing pages, user behaviour, user acquisition, traffic acquisition and website conversion journeys. CRM data becomes more valuable once leads move into qualification, opportunity and revenue, while advertising platforms provide another perspective on traffic and campaign performance.
None of these systems provides the complete customer experience or commercial picture on its own.
A stronger measurement architecture connects the stages:
Marketing channel → Website behaviour → Conversion → CRM lead → Qualified opportunity → Revenue
Once that relationship is understood, the conversation becomes much more useful. Instead of repeatedly asking why two dashboards disagree, teams can focus on which metric is appropriate for the decision they are trying to make.
That is ultimately what good metric governance should solve.
18. DIGITXL Point of View
If a business has three dashboards showing three different versions of the same KPI, the problem is usually not the dashboard.
It is usually a sign that metric governance has never been properly defined.
Choosing whichever number appears most believable does not solve the problem, and forcing GA4, Looker Studio, BigQuery, advertising platforms and CRM systems to show identical totals can create an equally misleading view.
The stronger approach is to agree on what the metric represents, identify which source should answer that particular business question and make the calculation transparent enough that another person can reproduce it.
The goal is not perfect numerical alignment across every platform.
The goal is for teams to understand which number answers which business question, how it was calculated and why it should be trusted.
19. Final Thoughts
If GA4 numbers look different in Google Reports, do not assume that the tracking is broken or that one dashboard must be wrong.
Start by comparing the metric definition, source, calculation, filters, date range, dimensions and attribution logic. In many cases, teams are simply measuring slightly different things under the same KPI name.
The most important metrics should have one agreed definition, one understood source and one accountable owner. That gives marketing, analytics and leadership a consistent basis for making decisions even when different systems naturally provide different views of the customer journey.
If inconsistent GA4 reporting is making it difficult to trust performance data, DIGITXL can help standardise metric definitions, reconcile reporting across GA4, BigQuery, Looker Studio, advertising platforms, API reporting and CRM data, and build a measurement framework teams can use consistently.
20. FAQs
Q. Why Do GA4 Numbers Look Different in Google Reports?
A. GA4 numbers can differ because reports may use different dimensions, filters, date ranges, attribution settings, user definitions or calculation methods. Two reports can therefore use the same metric name while measuring the data under different reporting conditions.
Q. Why Does the Same GA4 Metric Change Between Reports?
A. The same metric can change when reports use different dimensions, filters, denominators, attribution logic or calculated fields. Before comparing the totals, check whether both reports are actually designed to answer the same business question.
Q. Which GA4 Number Should a Business Trust?
A. Use the metric that has an agreed business definition, a reproducible calculation and a clearly identified source. GA4 may be appropriate for website behaviour, while CRM or financial systems may be better sources for qualified leads or revenue.
Q. Can Looker Studio Show Different Numbers From GA4?
A. Yes. Looker Studio can introduce additional filters, dimensions, calculated fields, custom dimensions and blended data sources, so a dashboard may not exactly reproduce the GA4 interface even when GA4 is the underlying data source.
Q. Can BigQuery or an API Report Differ From GA4?
A. Yes. BigQuery provides event-level data that can be transformed using custom SQL, while the Google Analytics Data API returns data according to the metrics, dimensions and filters requested. Either can differ from a standard GA4 report when the underlying reporting logic is not identical.
Q. Can DIGITXL Help Standardise GA4 Reporting?
A. Yes. DIGITXL can review GA4 metric definitions, Looker Studio calculations, BigQuery logic, Data API reporting and CRM measurement to establish consistent KPIs, clear reporting ownership and a shared measurement framework across teams.

Recent Posts


Case Studies
Business News Australia
On Track Meals
Suncorp