1. What Does Revenue Quality Actually Mean?
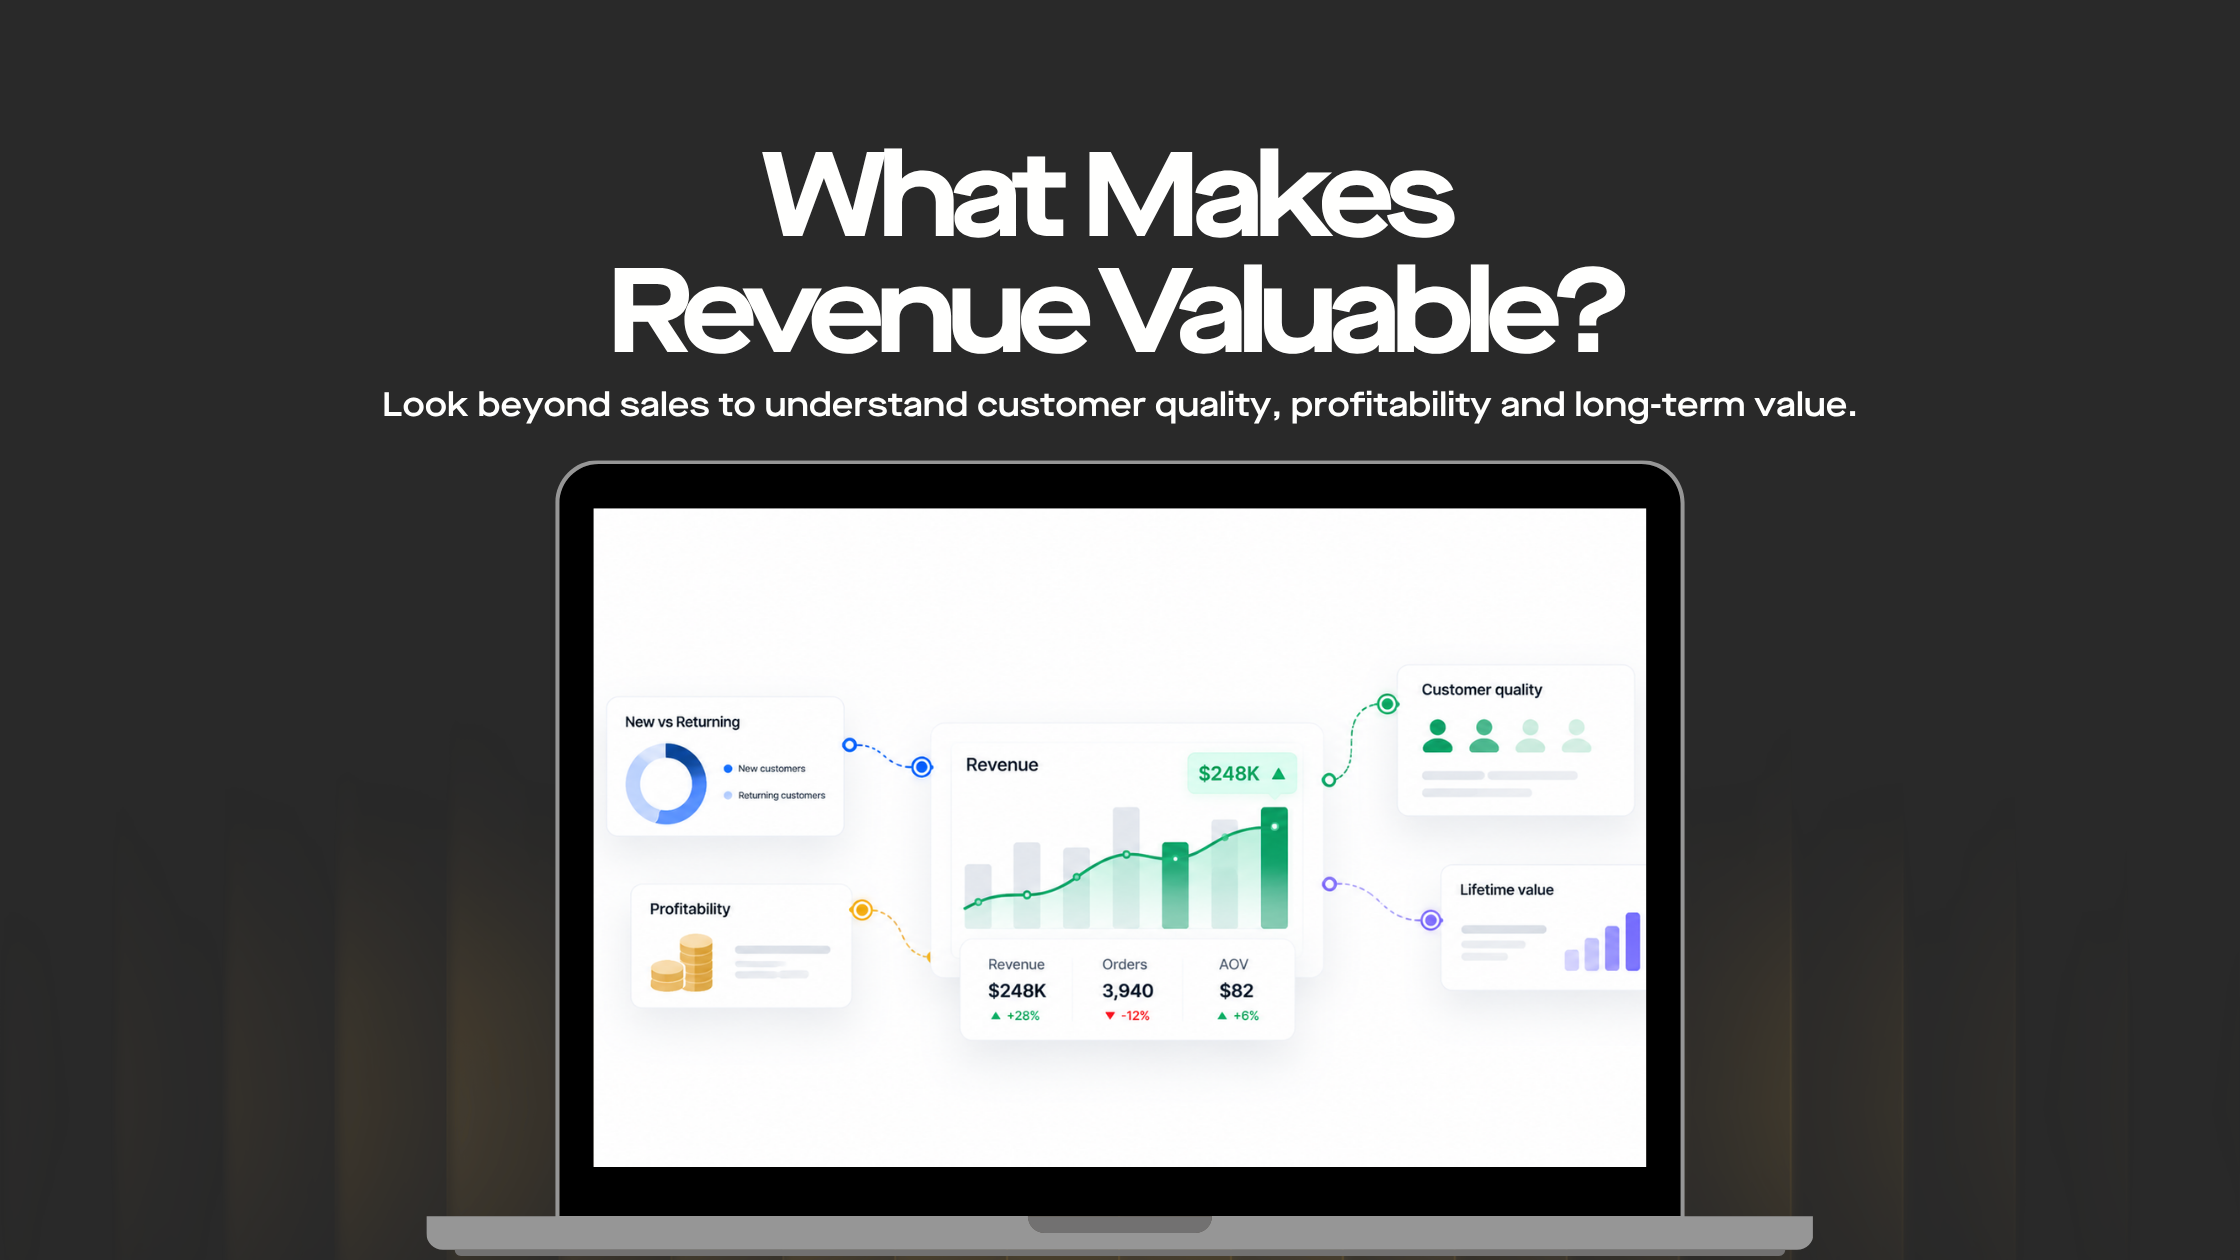
Revenue quality is about understanding more than the amount of revenue a business generated during a particular period. It looks at where that revenue came from, how much it cost to generate, the type of customers it attracted and whether those customers are likely to create value beyond the initial transaction.
This makes revenue quality different from basic revenue reporting. A standard performance report may tell you that revenue increased by 15%, but revenue analysis needs to explain what caused that increase and whether it represents sustainable commercial growth.
Two businesses can generate the same amount of revenue and still be in very different commercial positions.
One business may have strong repeat purchase behaviour, healthy margins, relatively low refund rates, efficient customer acquisition and customers with high lifetime value. Another may be generating the same revenue through heavy discounting, increasingly expensive acquisition, high returns and customers who rarely purchase again.
The revenue figures may look similar in a monthly report, but the underlying quality of that revenue is very different.
This is why revenue quality needs to be assessed alongside broader business performance, financial performance, financial metrics, business objectives, strategic objectives, customer experience and commercial outcomes.
A useful revenue quality framework should connect revenue performance with profitability, customer value, acquisition efficiency and financial performance rather than treating revenue as an isolated number.
2. How Do You Measure Revenue Quality?
There is no single metric that can tell you whether revenue is high quality. A better approach is to look at several Key Performance Indicators, performance indicators and financial metrics together and understand how they influence one another.
For example, revenue growth accompanied by stable acquisition costs, a higher average order value and stronger repeat purchase behaviour is a much healthier signal than revenue growth driven by rising acquisition costs, heavier discounting and declining customer retention.
A practical revenue quality assessment should consider:
- Revenue growth
- Revenue per visitor
- Customer acquisition cost
- Average order value
- Gross margin
- Discounting
- Refunds and returns
- Repeat purchase
- Customer lifetime value
- Conversion rate
- Customer behaviour
- Return on Investment
- Return on Ad Spend
- Customer retention
- Revenue attribution
- Profit margin
- Operating costs
- Customer acquisition efficiency
- Revenue performance
- Customer profitability
- Marketing performance
These measures provide a more complete view of revenue performance and financial performance than revenue alone.
The purpose is not to create another complicated reporting system. It is to understand what is behind the revenue number and whether the underlying conditions support continued performance improvement, sustainable growth, profitable growth and long-term success.
This is also why businesses should think about revenue quality metrics as a connected group rather than looking for one metric that can answer every commercial question.
3. Why Revenue Alone Can Give You the Wrong Answer
Revenue is a lagging indicator. It tells you what happened, but it does not necessarily explain why it happened or whether the conditions that produced the result are sustainable.
Consider an ecommerce business that reports a 15% increase in revenue. On the surface, this appears to be a positive result. However, suppose the same period also produced a 25% increase in advertising spend, a 10% reduction in average order value, greater use of discounts, higher refund rates and weaker repeat purchase behaviour.
The business has generated more revenue, but the quality of that revenue may have deteriorated.
A useful performance report should therefore go beyond showing that revenue increased or decreased. It should help the team understand where the change came from, what it cost to generate, how customers behaved and whether the improvement is likely to continue.
This moves reporting away from simply tracking revenue and towards revenue analysis, marketing performance measurement, commercial decision-making and business performance analysis.
It can also reveal an early warning sign when revenue appears healthy but profitability, customer value or cost efficiency are moving in the wrong direction.
A revenue increase accompanied by rising operating costs, business expenses and acquisition costs may produce a weaker financial result than the headline revenue figure suggests.
4. The Five Dimensions of Revenue Quality
A practical way to assess revenue quality is to look at five connected dimensions.
Dimension
Example metrics
What it tells you
- Revenue
- Revenue, revenue per visitor
- How much was generated
- Acquisition efficiency
- CAC, ROAS, ROI
- What it cost to generate
- Customer value
- AOV, repeat purchase, LTV
- Who generated the revenue
- Profitability
- Margin, discounts, refunds
- How valuable the revenue is
- Behaviour
- Conversion, retention, journey behaviour
- What customers did
No single metric provides the complete picture. The value comes from understanding the relationship between them.
For example, a revenue increase accompanied by higher customer acquisition cost and lower customer lifetime value deserves a very different interpretation from revenue growth accompanied by stronger repeat purchase behaviour and stable acquisition costs.
This is also why a dashboard containing dozens of Key Performance Indicators does not necessarily provide better performance visibility. The useful metrics are the ones that help explain the commercial outcome and support a decision.
For finance teams, these measures should ultimately connect with the numbers appearing in financial reports, budgets and management reporting. Marketing may focus on conversion and acquisition efficiency, while finance may focus on margin, cash flow and operating costs.
Revenue quality provides a bridge between those perspectives.
5. Quality of Revenue Starts with the Customer
Ultimately revenue is created by customers, so to understand revenue quality you need a clear view on user behaviour, customer behaviour and customer experience.
That means moving beyond the last transaction and understanding the customer journey that brought them to it.
That journey for ecommerce might be:
Traffic → Product View → Add to Cart → Checkout → Purchase → Repurchase
For lead generation it could be:
Traffic → Enquiry → Marketing Qualified Lead → Sales Qualified Lead → Opportunity → Customer → Income
There’s helpful context at each stage.
If you see a sudden drop in completed purchases, it may not have anything to do with checkout but instead that fewer qualified visitors are visiting the website. Similarly, a promotional campaign could bring in customers who are less likely to come back, increasing the number of transactions.
Without this behavioural context, the revenue figure tells only part of the story.
This is why behavioural analytics, customer journey analytics, customer analytics, funnel analysis, conversion analytics and customer experience metrics are important parts of revenue measurement.
A strong digital analytics strategy should connect what customers do on the website with the commercial outcomes that follow.
6. Which Metrics Help Measure Revenue Quality?
6.1 Revenue per visitor
A cro agency can use revenue per visitor alongside conversion rate, average order value and customer acquisition cost to understand whether website improvements are generating meaningful commercial value. Rather than focusing only on increasing conversions, this approach helps businesses assess whether those conversions are contributing to profitable growth.
A simplified calculation is:
Revenue ÷ visitors
If traffic increases by 30% but revenue per visitor falls significantly, the additional traffic may not be as valuable as the headline revenue figure suggests.
This is particularly useful when evaluating marketing channels, landing pages or conversion rate optimisation changes where traffic volume and conversion behaviour are both changing.
Revenue per visitor can also help compare traffic quality across acquisition channels and customer segments.
6.2 Average order value
Average order value provides another layer of context because it shows how much customers are spending on each transaction.
The calculation is:
Revenue ÷ orders = AOV
An increase in AOV can indicate a stronger product mix, effective cross-selling or customers purchasing more during each transaction.
A decline in AOV alongside rising conversion, however, can tell a very different story from rising conversion combined with higher transaction value.
AOV is therefore one of the useful ecommerce performance metrics for understanding transaction value.
6.3 Cost per acquisition
Cost per acquisition helps measure how efficiently the business is acquiring customers.
If revenue increases while acquisition costs increase at a much faster rate, the business may be buying growth rather than creating efficient growth.
This becomes particularly important when comparing paid media channels, marketing campaigns and customer acquisition strategies.
6.4 Return on Ad Spend
Return on Ad Spend, or ROAS, helps measure the revenue generated relative to advertising expenditure.
It is useful for understanding marketing efficiency, but it should not be treated as a complete measure of profitability.
A campaign can have strong ROAS while still producing weaker commercial results if margins are low, returns are high or customers have limited repeat value.
6.5 Customer lifetime value
Customer lifetime value adds a longer-term perspective to revenue analysis.
A customer who makes one purchase using a significant discount is commercially different from a customer who purchases repeatedly at healthy margins. Where reliable customer data is available, LTV can help determine whether an acquisition or CRO strategy is attracting customers who create lasting value rather than simply increasing first-purchase volume.
Customer lifetime value should therefore be considered alongside customer acquisition cost, customer retention, repeat purchase rate and customer profitability.
7. The Behaviour Behind the Revenue Number
A change in revenue usually has a behavioural story behind it, and analytics can help uncover that story.
Suppose revenue falls by 12%. That number alone does not tell you what happened. You might find that traffic declined by 5%, product views declined by 2%, items added to cart declined by 8% and checkout completion declined by 15%.
That gives the team several areas to investigate.
The opposite situation can also be revealing. Suppose traffic increases by 20%, conversion rate falls by 10% and revenue still increases by 3%. The business is generating more revenue, but the increase is much smaller than the growth in traffic.
That could indicate a change in traffic quality, customer intent, product demand or website experience.
This is where behavioural metrics become useful. Rather than asking only whether revenue changed, the team can investigate the customer behaviours that contributed to the change.
Using Google Analytics 4, for example, teams can examine traffic sources, user behaviour, page views, sessions, events and conversion activity to identify where the customer journey changed.
The value comes from connecting those measurements rather than reviewing each metric independently.
This is the difference between simply collecting performance data and using analytics to produce actionable insights.
8. Separate Traffic Quality From Traffic Volume
More traffic is not necessarily better traffic.
A marketing campaign can produce a large increase in sessions while attracting visitors who are less likely to purchase. This is why traffic volume should be considered alongside conversion rate, revenue per visitor, average order value, new versus returning customers, customer acquisition cost and purchase behaviour.
For example, suppose organic traffic increases by 40%. That sounds positive, but if conversion rate falls from 3% to 1.8%, revenue per visitor also falls and the additional visitors have low customer value, the traffic increase may not represent meaningful commercial growth.
It can also be useful to examine traffic split by channel, campaign, device, geography and customer type. Session metrics can help identify whether a change in traffic quality is influencing conversion or revenue.
The more useful question is not simply whether traffic increased. It is whether the additional traffic created valuable customers.
This is particularly important for marketing performance analytics, because a channel can produce strong traffic volume without producing equally strong commercial outcomes.
9. Look at Revenue by Customer Type
Revenue quality can change depending on who is buying.
Consider the difference between new customers, returning customers, high-value customers, discount-driven customers, subscription customers and customers acquired through different marketing channels.
A monthly revenue report that combines all of these groups can hide important changes.
For example, total revenue might be flat, but revenue from returning customers might be declining, while first-time purchases might be increasing. If the business is successfully growing its customer base, this may be a good thing, but it may also indicate a retention problem.
The next step is to know the behaviour and value of each group of customers.
This is where customer segmentation, customer analytics and cohort analysis can be useful. They enable the team to compare customer value, purchase frequency, retention and revenue contribution, instead of treating each customer as equal.
It may also help identify differences in customer acquisition efficiency, customer profitability and customer lifetime value between segments.
10. Discounting Can Make Revenue Look Better Than It Is
Promotions can have a significant impact on revenue, but additional sales should be considered alongside discount depth, average order value, gross margin, customer acquisition cost, return rates, repeat purchase and customer lifetime value.
Imagine a promotion increases orders by 25%. If most of those purchases require a substantial discount and few of those customers return, the commercial outcome may be weaker than the transaction growth suggests.
This does not mean discounts are necessarily a problem. It means the business needs to understand what type of revenue the promotion is generating and whether that revenue remains valuable after the promotion ends.
This is particularly relevant during major promotional periods, when conversion rate, transaction rates, revenue growth and ecommerce performance can increase quickly while margin and customer quality move in the opposite direction.
11. Refunds, Returns and Cancellations Matter
A transaction is not always the end of the commercial story.
For ecommerce businesses, revenue reporting should also consider what happens after the purchase. A high return rate can change the economics of a campaign that initially appeared successful.
The same applies to refunds, cancellations, chargebacks, failed payments and customer service costs.
If a CRO test increases completed transactions but also produces a meaningful increase in returns, the test should not be judged solely on its original conversion uplift.
Commercial measurement needs to extend beyond the conversion funnel and consider the complete customer lifecycle.
This is why ecommerce analytics should not stop at the purchase event. Where data is available, teams should connect transaction data with refunds, returns, cancellations and repeat purchase behaviour.
12. Revenue Reconciliation: Which Number Is the Source of Truth?
One of the biggest challenges in measuring revenue quality is that different systems may report different numbers.
You may have GA4 revenue, ecommerce platform revenue, payment provider revenue, CRM revenue and finance revenue. These numbers do not always match, and that does not necessarily mean one system is incorrect.
Different platforms can use different definitions, attribution rules, processing times and exclusions.
The important thing is to understand those differences and establish which source should be used for each business decision.
For example, GA4 may be useful for understanding digital behaviour and attributed revenue, while the ecommerce platform may provide the operational transaction record and finance may provide the recognised commercial result.
The source of truth should therefore be defined according to the decision being made.
This is an important part of data quality, measurement accuracy, data validation, revenue attribution and revenue reconciliation.
Without reconciliation, marketing may optimise against one revenue number while finance evaluates another.
It also reduces the risk of making costly mistakes based on numbers that appear consistent but have different definitions behind them.
A strong measurement framework should document these differences rather than assuming that every platform is measuring revenue in exactly the same way.
13. Build a Revenue Quality Scorecard
A useful revenue quality scorecard should combine commercial outcomes with the behavioural information that helps explain them.
- Category
- Metric
- Question
- Revenue
- Total revenue
- How much did we generate?
- Efficiency
- CAC
- What did acquisition cost?
- Efficiency
- ROAS
- How efficiently did advertising generate revenue?
- Conversion
- Conversion rate
- How effectively did visitors convert?
- Value
- AOV
- How much did customers spend per transaction?
- Value
- LTV
- What is the longer-term customer value?
- Behaviour
- Add to cart
- Are customers showing purchase intent?
- Behaviour
- Checkout completion
- Where are customers dropping off?
- Retention
- Repeat purchase
- Are customers coming back?
- Quality
- Refund rate
- How much revenue is being reversed?
The scorecard does not need to become another enormous dashboard. Its purpose is to give decision makers enough performance visibility to understand whether revenue growth is healthy and where further investigation is required.
The metrics should also align with the organisation’s strategic objectives and business objectives rather than being selected simply because they are available in the analytics platform.
A good performance dashboard should help answer commercial questions rather than simply display every available metric.
14. Leading Indicators and Lagging Indicators
A strong reporting framework separates leading indicators from lagging indicators.
Revenue is generally a lagging indicator because it reflects an outcome that has already happened. Behavioural measures can provide earlier signals about where performance may be heading.
Leading indicators can include product engagement, items added to cart, checkout progression, form completion, traffic quality and customer engagement.
Lagging indicators can include revenue, gross margin, customer lifetime value, repeat purchase, refund rate and profit.
The value comes from connecting the two.
If checkout completion falls sharply today, the business may have an opportunity to investigate the issue before the revenue impact becomes significant.
That is where analytics becomes more useful than retrospective reporting. It can help the team identify the behaviour that is changing before the full commercial impact appears in the financial results.
This approach creates stronger performance measurement, performance assessment and performance improvement.
15. How to Analyse Revenue Quality When Performance Changes
When revenue changes, do not immediately assume the problem is conversion rate. A useful approach to How to Analyse Revenue Quality starts by breaking the revenue number into the customer and commercial factors that produced it.
15.1 Step 1: Check traffic
Start by checking users, sessions, traffic sources, campaigns and the balance between new and returning visitors.
Session metrics can help establish whether the change began before customers reached the website experience.
15.2 Step 2: See how your customers behave
Then look at page views, product engagement, adds to cart, checkout progression, site search, and exit behaviour.
These measures can help you identify where customers are behaving differently.
15.3 Step 3: Verify conversion
A well-structured conversion rate optimisation service should go beyond identifying where visitors drop off. It should examine why customers hesitate, which parts of the journey create friction and whether improving those experiences leads to higher-quality revenue. This helps businesses prioritise changes based on commercial impact rather than conversion rate alone.
15.4 Step 4: Check the value of the transaction
Look at average order value, product mix, discounts and promo activity.
A change in the transaction value can account for a revenue move even if the order volume has been relatively stable.
15.5 Step 5: Check post purchase behaviour
Review refunds, cancellations and returns, check if repeat purchase behaviour has changed.
This helps to see if the original transaction is turning into the anticipated customer value.
15.6 Step 6: Balance the numbers
Finally, make sure that you validate the revenue movement across the relevant systems and understand any differences between analytics, ecommerce, CRM and finance data.
It helps distinguish a real commercial change from a reporting or measurement problem and gives the team a better basis for assessing performance and making data-driven decisions.
16. Revenue Quality and Financial Performance
Revenue quality ultimately has to connect with financial performance.
Marketing and digital teams may focus on conversion rates, traffic and customer behaviour, but the business also needs to understand how those changes affect gross margin, operating costs, business expenses and ultimately sustainable profits.
For example, an increase in orders may look positive from a CRO perspective, but the financial result can be weaker if direct costs, supplier costs, fulfilment costs or customer service costs have increased at a faster rate.
This is why revenue analysis should consider the costs associated with generating and servicing that revenue.
Depending on the business model, these may include:
- Direct costs
- Direct labour
- Employee salaries
- Supplier costs
- Manufacturing costs
- Business overheads
- Common overheads
- Administration wages
- Office supplies
- Accounting fees
- Professional memberships
- Legal advice
- Marketing costs
- Advertising costs
- Fulfilment costs
- Customer service costs
- Other operating expenses
These financial metrics do not all need to appear in a CRO dashboard. The important point is to establish which costs materially influence the commercial outcome being measured.
For example, Business B may report strong online sales growth, but if its supplier costs, employee salaries and common overheads have increased faster than revenue, the business may not be improving financially.
The revenue dashboard would show growth. A proper financial performance review would tell a different story.
This is why revenue quality should connect digital performance with profitability analysis, cost management, financial reporting, financial planning and business forecasting.
17. Which Financial Metrics Should Be Connected to Revenue?
Revenue quality becomes much more useful when it is connected to the financial measures that determine whether the business is actually becoming more profitable.
Gross profit shows what remains after direct costs have been deducted from revenue. Gross margin provides the same relationship as a percentage, making it easier to compare products, channels or periods.
Operating profit and operating margin go a step further by accounting for operating expenses and business overheads.
For a growing business, contribution margin can also be useful because it helps show how much revenue remains after variable costs and therefore how much each additional sale contributes towards fixed costs and profitability.
These measures can change the interpretation of digital performance.
An 8% conversion rate increase from a CRO experiment seems like a win. But if the extra orders are for heavily discounted products with low contribution margins, the financial benefit may be much smaller than expected.
For instance, a marketing channel which generates less revenue but higher-margin customers can be more commercially valuable than a channel which generates more transactions at a much higher cost.
This is why profitability metrics, profit analysis, customer profitability and channel profitability can provide important context for digital performance measurement.
18. Revenue Quality Is Not an Accounting Exercise
There is a tendency to treat profitability and cost analysis as an accounting exercise that happens separately from marketing and digital reporting.
That separation can create problems.
The marketing team may optimise conversion and acquisition. The digital team may improve customer experience. Finance may review margins and business expenses. Senior leadership then has to bring those pieces together when making financial decisions.
A stronger approach is to establish the proper structure upfront.
Marketing and finance do not need identical dashboards, but they should agree on how revenue is defined, which costs matter, how customer value is measured and which financial metrics should be used to assess commercial performance.
This makes it easier to move from retrospective reporting to proactive decisions.
It also helps the business prepare for periods such as tax time, when financial records, revenue figures and expenses need to be clearly understood.
A Tax Return is not the same thing as a revenue-quality analysis, and a revenue dashboard is not a substitute for professional accounting advice.
A Chartered Accountant may be responsible for areas such as tax reporting and statutory financial requirements, while the digital and analytics team can help explain customer behaviour, acquisition performance and revenue generation.
Keeping those responsibilities clear is important.
19. Budgeting & Cost Management, Quality of Revenue
Revenue quality is also a factor in budget accuracy and financial planning.
Based on expected traffic, conversion rate and average order value and customer acquisition, a business can set an annual revenue target. If any of those assumptions change substantially, the revenue forecast may not reflect realistic performance.
If acquisition costs are up 20%, conversion rates are down and average order value remains the same, it may not be possible to just stick to the original revenue forecast.
This is where revenue analytics can assist with budget planning, revenue forecasting and cost management.
A practical business budget should connect expected revenue with the costs required to generate it. That may include advertising, direct costs, supplier costs, employee salaries, operating expenses and business overheads.
The aim is not to turn a marketing dashboard into an accounting system. It is to ensure that commercial teams understand the assumptions behind the targets they are being asked to achieve.
That creates a stronger foundation for confident business decisions.
20. How Should You Build a Revenue Performance Dashboard?
A revenue performance dashboard should make it easy to move from what happened to why it happened and then to what should happen next.
The first layer should show the commercial outcome, including revenue, orders, gross margin, profit contribution and revenue growth.
The second layer should explain the drivers, including traffic, conversion rate, average order value, customer acquisition cost, Return on Ad Spend and customer lifetime value.
The third layer should provide behavioural context, including product views, items added to cart, checkout progression, customer segments, new versus returning customers and customer journey behaviour.
The final layer should provide measurement confidence, including revenue attribution, data quality, source-of-truth definitions and reconciliation between analytics, ecommerce, CRM and finance systems.
This structure creates better decision visibility than a dashboard that simply displays dozens of metrics.
It also allows different teams to use the same underlying data for different purposes. Marketing can focus on acquisition efficiency, CRO teams can focus on conversion performance, ecommerce teams can focus on transaction value and finance can focus on profitability.
The dashboard becomes a decision tool rather than another reporting exercise.
21. From Financial Metrics to Better Business Decisions
The real value of revenue analytics comes when the data changes what the business does.
A performance dashboard should not simply tell the team that revenue is down. It should help identify the likely cause, the affected customer segment, the financial implications and the action that deserves further investigation.
22. Where DIGITXL Fits
As a cro agency, DIGITXL helps businesses connect customer behaviour, website performance and revenue outcomes. Our conversion rate optimisation service focuses on identifying friction across the customer journey, testing improvements and understanding how those changes influence conversion rates, customer value and overall business performance.
SEO recommendation: Keep both keywords as secondary keywords in this article. The primary focus should remain on revenue quality, revenue analytics and commercial performance. This avoids shifting the article towards a CRO service-page search intent.
That means looking at the relationship between:
Data → Behaviour → Conversion → Revenue → Customer Value → Financial Performance
A revenue change should lead to a question about customer behaviour. A behavioural change should lead to a question about commercial impact, and a commercial change should be checked against the underlying measurement before decisions are made.
This can involve GA4, Google Analytics, Google Tag Manager, ecommerce analytics, CRM information, BigQuery, dashboard software, funnel analysis and CRO research.
The objective is to give marketing and digital teams better visibility into why performance changed, rather than simply showing that it changed.
For businesses heading into Q4, this distinction becomes particularly important. When traffic, promotions and media investment increase, the ability to separate genuine commercial improvement from a measurement issue or a change in traffic and customer mix becomes much more valuable.
23. Final Thoughts
Revenue is important, but revenue alone does not tell you whether growth is healthy.
A useful view of revenue quality considers revenue, efficiency, customer value, behaviour, profitability and financial performance together. Looking at these factors gives the business a much clearer understanding of what is actually driving growth.
A revenue increase accompanied by stronger customer value, efficient acquisition and healthy repeat behaviour is very different from revenue growth driven by heavy discounting, rising acquisition costs and increasing operating expenses.
The same applies when revenue falls.
The most useful response is not simply to ask, “Why did revenue drop?” It is to understand what changed in customer behaviour, where the commercial impact occurred, what it cost the business and whether the numbers being used to make the decision can be trusted.
That is where analytics moves beyond reporting what happened and starts helping the business make more confident financial and commercial decisions.
The strongest revenue-quality frameworks connect digital analytics, customer behaviour, conversion performance, revenue measurement, profitability and financial performance rather than treating each area as a separate reporting exercise.