1.

If you’re an Analytics Developer or Digital Insights Manager, you’ve likely encountered the challenge of deciding how much data to collect. Should you gather everything, or focus only on the most relevant events in your analytics? In today’s data-driven world, metric overload in data collection is a common problem, especially with global data expected to reach 175 zettabytes by 2025. The key question is: In data overload which metrics need to be prioritised?
Handling the enormous volume of data across digital platforms can feel overwhelming. Every click, interaction, and conversion feeds into a sea of metrics. Companies often experience “data paralysis,” where too much information overwhelms decision-making. At DigitXL, our experience reveals that the solution lies in a thoughtful and strategic approach to metric overload in data collection.
Before diving into the numbers, it’s crucial to align your data strategy with your business goals. Whether your focus is increasing sales, enhancing user engagement, or boosting operational efficiency, your core objectives should guide which metrics you collect and analyse. This will help you determine which metrics need to be prioritised more in data overload.
2. Align Metrics with Business Goals

A Harvard Business Review survey revealed that businesses aligning their metrics with strategic objectives achieve a 3.2x improvement in performance. To avoid metric overload in data collection, your metric selection should be directly tied to your business goals.
Case Study: Teelixir, an e-commerce company, sought to boost its conversion rates by focusing on metrics like Customer Acquisition Cost and Average Order Value. This sharp focus led to an increase in conversion rates from 1.1% to 3.5% in just six months. By focusing on key metrics and understanding in data overload which metrics need to be prioritised, they turned data into actionable insights.
Action Steps:
-
- Identify Core Goals: Define what success looks like for your business. Are you aiming to increase customer acquisition, improve operational efficiency, or boost customer satisfaction?
- Select Relevant Metrics: If your goal is increasing conversion rates, focus on metrics such as Customer Acquisition Cost (CAC) and Lifetime Value (LTV). By aligning these with your objectives, you can avoid metric overload in data collection and ensure your data is actionable.
3. Categorising Metrics

Understanding and categorising metrics helps us focus on what matters:
- Vanity Metrics: Superficial metrics that look good on paper but don’t impact business outcomes (page views, social media followers).
- Operational Metrics: Metrics that reflect process efficiency (response times, system uptime).
- Strategic Metrics: Key performance indicators that directly affect business goals ( revenue growth, customer lifetime value).
Action Steps
- Create a Metrics Dashboard: Develop a dashboard that categorises metrics into vanity, operational, and strategic. Update this regularly to reflect changing business priorities.
- Regular Reviews: Conduct quarterly reviews of these metrics to ensure they remain aligned with business objectives and provide actionable insights.
4. Tools and Technologies
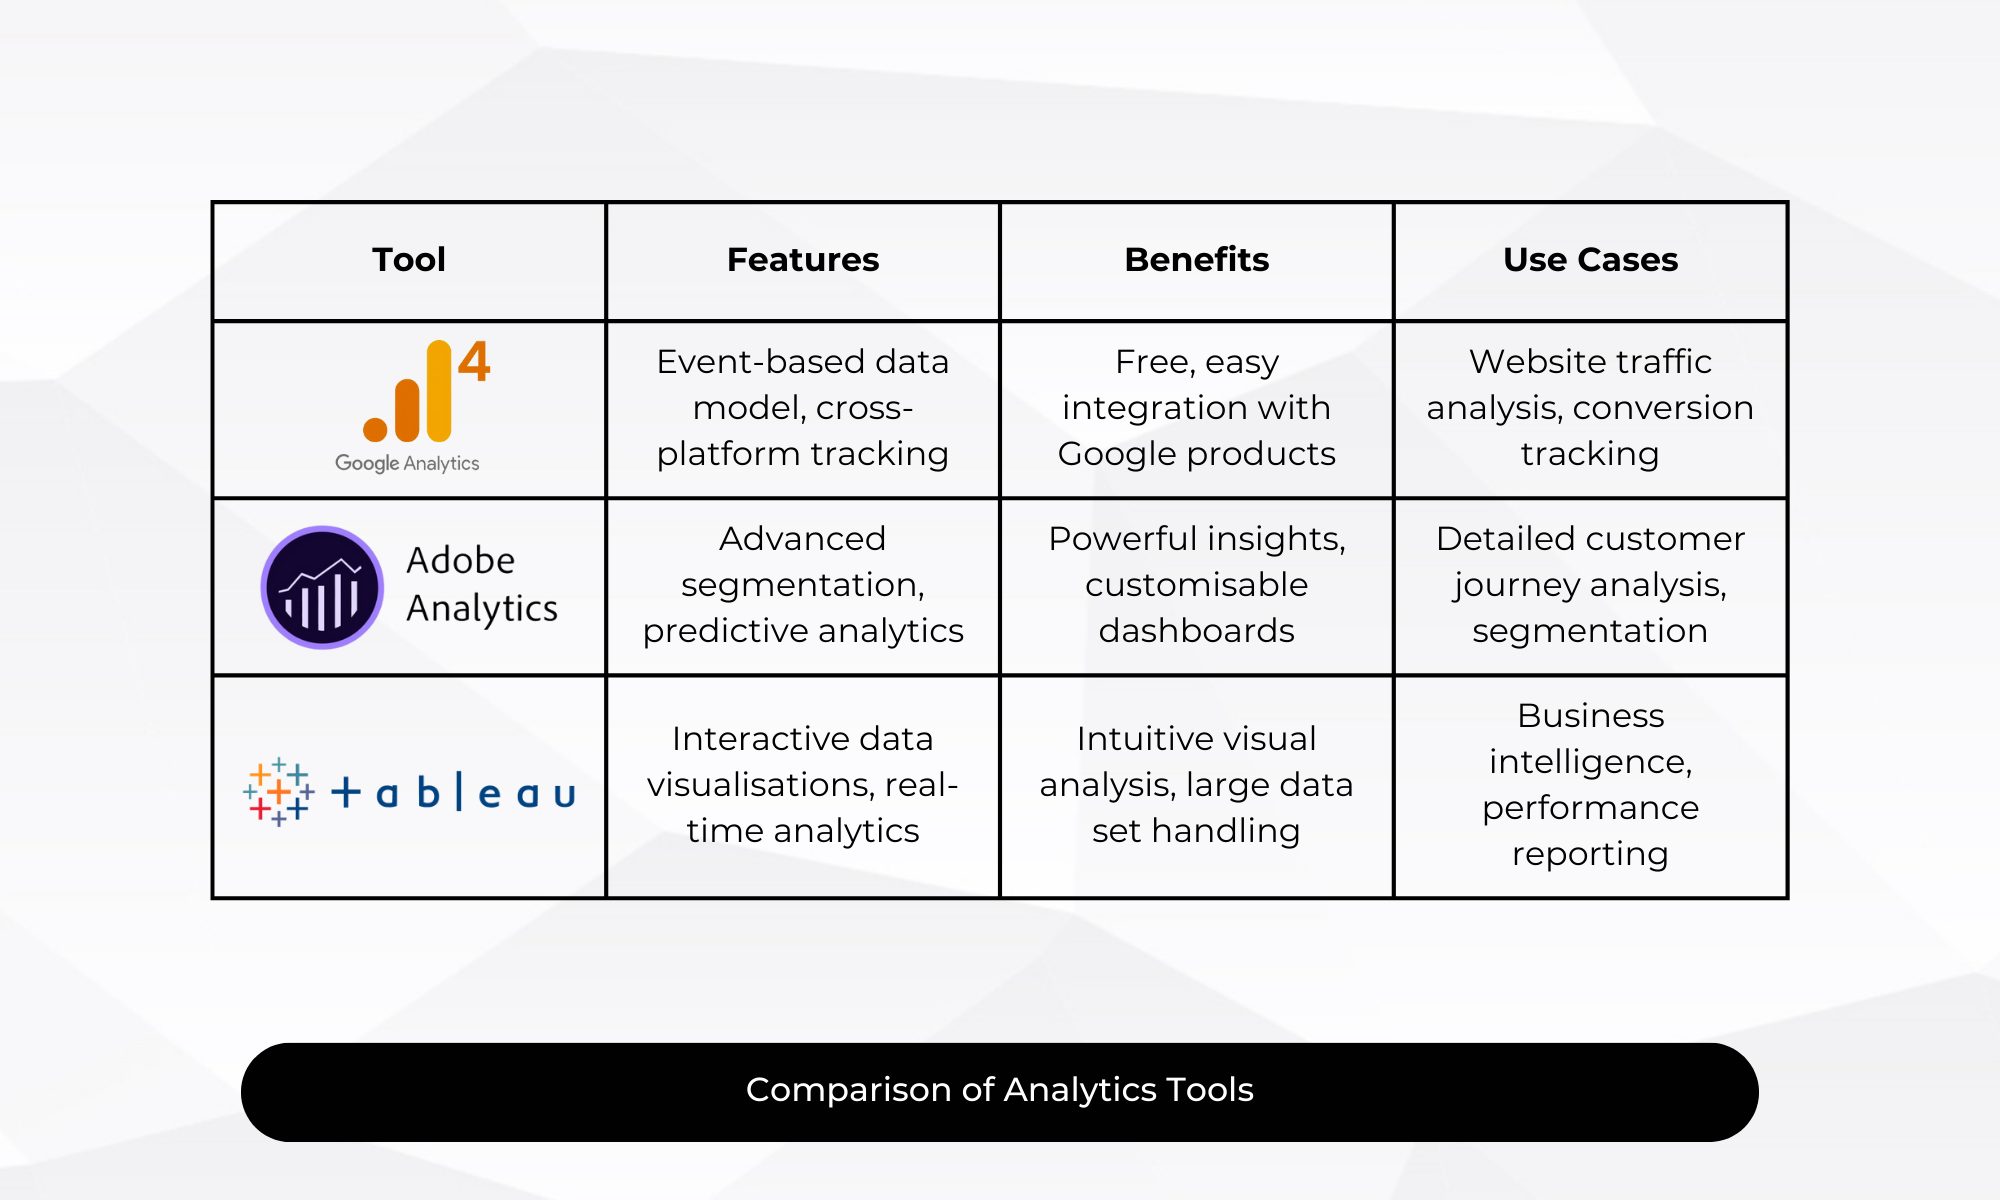
Advanced Analytics
Using sophisticated tools can greatly improve your data analysis capabilities. Businesses investing in advanced analytics report a 25-30% improvement in decision-making speed and accuracy.
Recommended Tools:
- Google Analytics 4: Offers comprehensive insights into user behaviour and conversion paths.
- Adobe Analytics: Provides robust segmentation and predictive analytics.
- Tableau: Transforms complex data into intuitive visualisations, aiding decision-making.
5. Data Governance
A well-structured data governance framework is essential for maintaining data quality and reliability. Forrester reports that poor data quality can lead to a 40% increase in operational costs.
Action Steps:
- Develop Governance Policies: Create clear policies for data validation, cleaning, and auditing.
- Implement Regular Audits: Conduct regular data audits to ensure compliance with governance standards.
6. Case Studies and Real-World Applications
Suncorp
After conducting in-depth stakeholder interviews, we created playbooks to make sure we had recorded the crucial measurements and dimensions that are necessary to avoid overcooking the recipe.
Latitude Financial:
Latitude Financial, dealing with data accuracy issues, implemented a standardised strategy using Adobe Analytics and Tealium. This led to a 35% improvement in data reliability and a 25% reduction in reporting time.
Energy Australia
In order to avoid making extra Adobe Server Calls, we established a strategic data layer and gathered the data in that manner. Additionally, we were able to develop complex segments to analyse the user journeys by collecting only essential data, mostly through the leveraging of Evar variables.
7. Practical Tips for Managing Data Overload
Regular Audits
- Quarterly Reviews: Regularly audit your KPIs to ensure they are aligned with your goals and provide actionable insights.
- Action: Adjust your metrics and data collection methods based on these reviews to stay aligned with your objectives.
Automate Data Collection
- Tools: Utilise tools like Google Analytics 4 for automation to streamline data collection and reduce manual errors.
- Action: Implement automation wherever possible to enhance efficiency and accuracy.
Focus on User Behaviour
- Metrics: Analyse user behaviour metrics such as Average Session Duration to understand customer engagement and improve site performance.
- Action: Use these insights to refine your strategies and enhance user experience.

 Previous