1. What Are Filters in Data Studio?
Filters in Data Studio are tools that help refine the data displayed in your reports and dashboards. They allow you to focus on specific subsets of data based on defined criteria. For example, you might use a filter to:
- Show data for a specific region or device.
- Focus on a particular campaign or traffic source.
- Exclude irrelevant or outlier data.
Filters enable users to analyse data at a granular level, uncovering trends and patterns that may otherwise remain hidden in aggregated datasets.
2. Types of filters in Data Studio
Data Studio provides several types of filters that cater to different reporting needs:
1. Report Filters
- Apply to all pages and charts within a report.
- Ideal for setting overarching parameters, such as focusing on a specific date range or region.
2. Page-Level Filters
- Apply to all visualisations on a specific page.
- Useful for dashboards with multiple pages, where each page serves a different purpose or audience.
3. Chart-Level Filters
- Apply to individual charts or tables.
- Allow for highly customised views, such as isolating performance metrics for a single campaign.
4. Filter Controls
- Interactive filters that allow viewers to dynamically adjust data displayed in the report.
- Examples include dropdown menus, sliders, and checkboxes.
3. How to use filters in Data Studio
1. Adding a Filter to a Chart or Table
Filters can be applied directly to visual elements to narrow the focus of displayed data.
- Select a chart or table in your report.
- Open the Setup Panel on the right.
- Under the Filter section, click Add a Filter.
- Choose an existing filter or create a new one.
2. Creating a Custom Filter
To create a new filter:
- Go to the Resource menu at the top and select Manage Filters.
- Click Add a Filter.
- Define your filter conditions using dimensions, metrics, and operators. For instance:
- Dimension: Country
- Operator: Equals
- Value: Australia
- Save and apply the filter to your desired charts or pages.
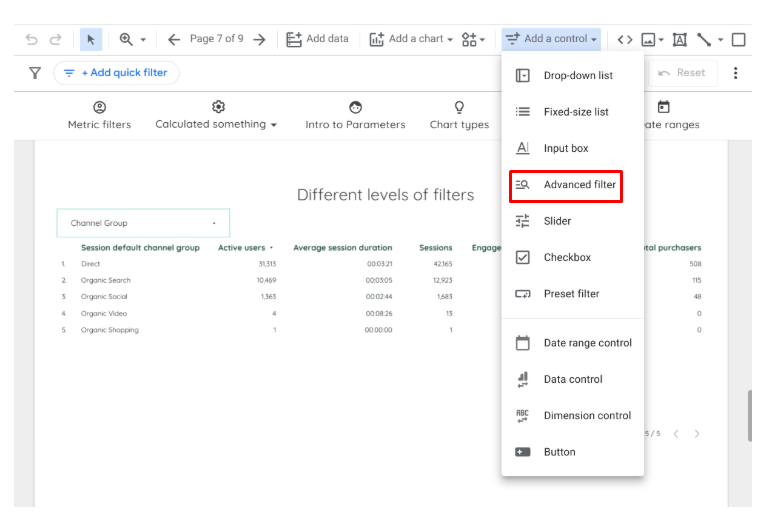
3. Using Filter Controls for Dynamic Reports
Filter controls are an interactive way to allow viewers to customise the report view.
- From the toolbar, click Add a Control and select the filter type (e.g., dropdown, slider).
- Place the control on your report canvas.
- Configure the control to filter based on a specific dimension, such as Date, Campaign, or Device.
4. Cascading Filters
Cascading filters allow multiple filters to interact with each other. For example, filtering by Country can dynamically adjust options available in a City filter.
To set this up:
- Add multiple filter controls to your report.
- Ensure the filters are based on related dimensions (e.g., Country and City).
- The secondary filter will automatically update based on the primary filter’s selection.
5. Excluding Data Using Filters
Filters can also exclude unwanted data from your reports:
- Create a custom filter.
- Use the Exclude option in the filter setup.
- Define the condition, such as Exclude Traffic Source = Spam.
This approach is useful for removing irrelevant traffic, bots, or outliers.
4. Best Practices for Using Filters in Data Studio
1. Define Your Goals
Before adding filters, identify the questions you want your dashboard to answer. For example, a CRO agency may need to compare conversion behaviour by device, traffic source, landing page or audience segment, so the filters should be structured around those specific analysis needs.
2. Keep Filters User-Friendly
If your report is intended for non-technical stakeholders, use interactive filter controls like dropdowns or sliders. This makes it easier for viewers to explore the data without navigating complex configurations.
3. Avoid Over-Filtration
Applying too many filters can obscure important data trends or insights. Strive for balance by focusing on high-priority metrics and dimensions.
4. Use Descriptive Labels
Clearly label your filters so viewers understand their purpose. For example, instead of a generic “Filter,” label it as “Filter by Region” or “Select Campaign.”
5. Test Filter Interactions
If your report includes multiple filters, test how they interact to ensure the data behaves as expected. For example, check that selecting Country = Australia automatically updates charts to reflect only Australian data.
4.1 Examples of Practical Applications
1. Ecommerce Dashboard
- Use a filter to display sales data for a specific product category.
- Add a filter control for users to select a custom date range.
2. Marketing Campaign Report
- Filter by campaign source or medium to analyse performance.
- Exclude internal traffic to get a clearer picture of user behaviour.
3. Website Traffic Analysis
- Add a filter to focus on mobile or desktop traffic.
- Use cascading filters to drill down from continent to country to city.
4. Regional Performance Report
- Apply a filter to show metrics for a specific region or market.
- Use interactive filters to let viewers compare performance across regions.
4.2 Common challenges and how to overcome them
1. Filters Not Applying as Expected
- Solution: Double-check that the filter is applied to the correct chart, page, or report level.
2. Conflicting Filters
- Solution: Ensure filters aren’t contradicting each other. For instance, avoid applying a global filter that excludes data needed for a chart-level filter.
3. Performance Issues
- Solution: Avoid overly complex filters or large datasets that slow down the report. Simplify where possible.
5. Conclusion
Filters in Data Studio are powerful tools that can transform your dashboards from generic to highly tailored and insightful. By using filters effectively, you can:
- Highlight critical data.
- Provide personalised insights to stakeholders.
- Streamline decision-making with focused reports.
Whether you’re creating a report for marketing, sales, or operations, filters enable you to cut through the noise and present data that matters. With a combination of static filters, dynamic controls, and cascading interactions, Data Studio equips you with everything you need to build meaningful dashboards.
If you’re ready to take your data visualisation to the next level, start experimenting with filters in Data Studio today. For expert guidance or custom dashboard support, feel free to reach out to Digitxl. Let’s make your data work for you!

 Previous