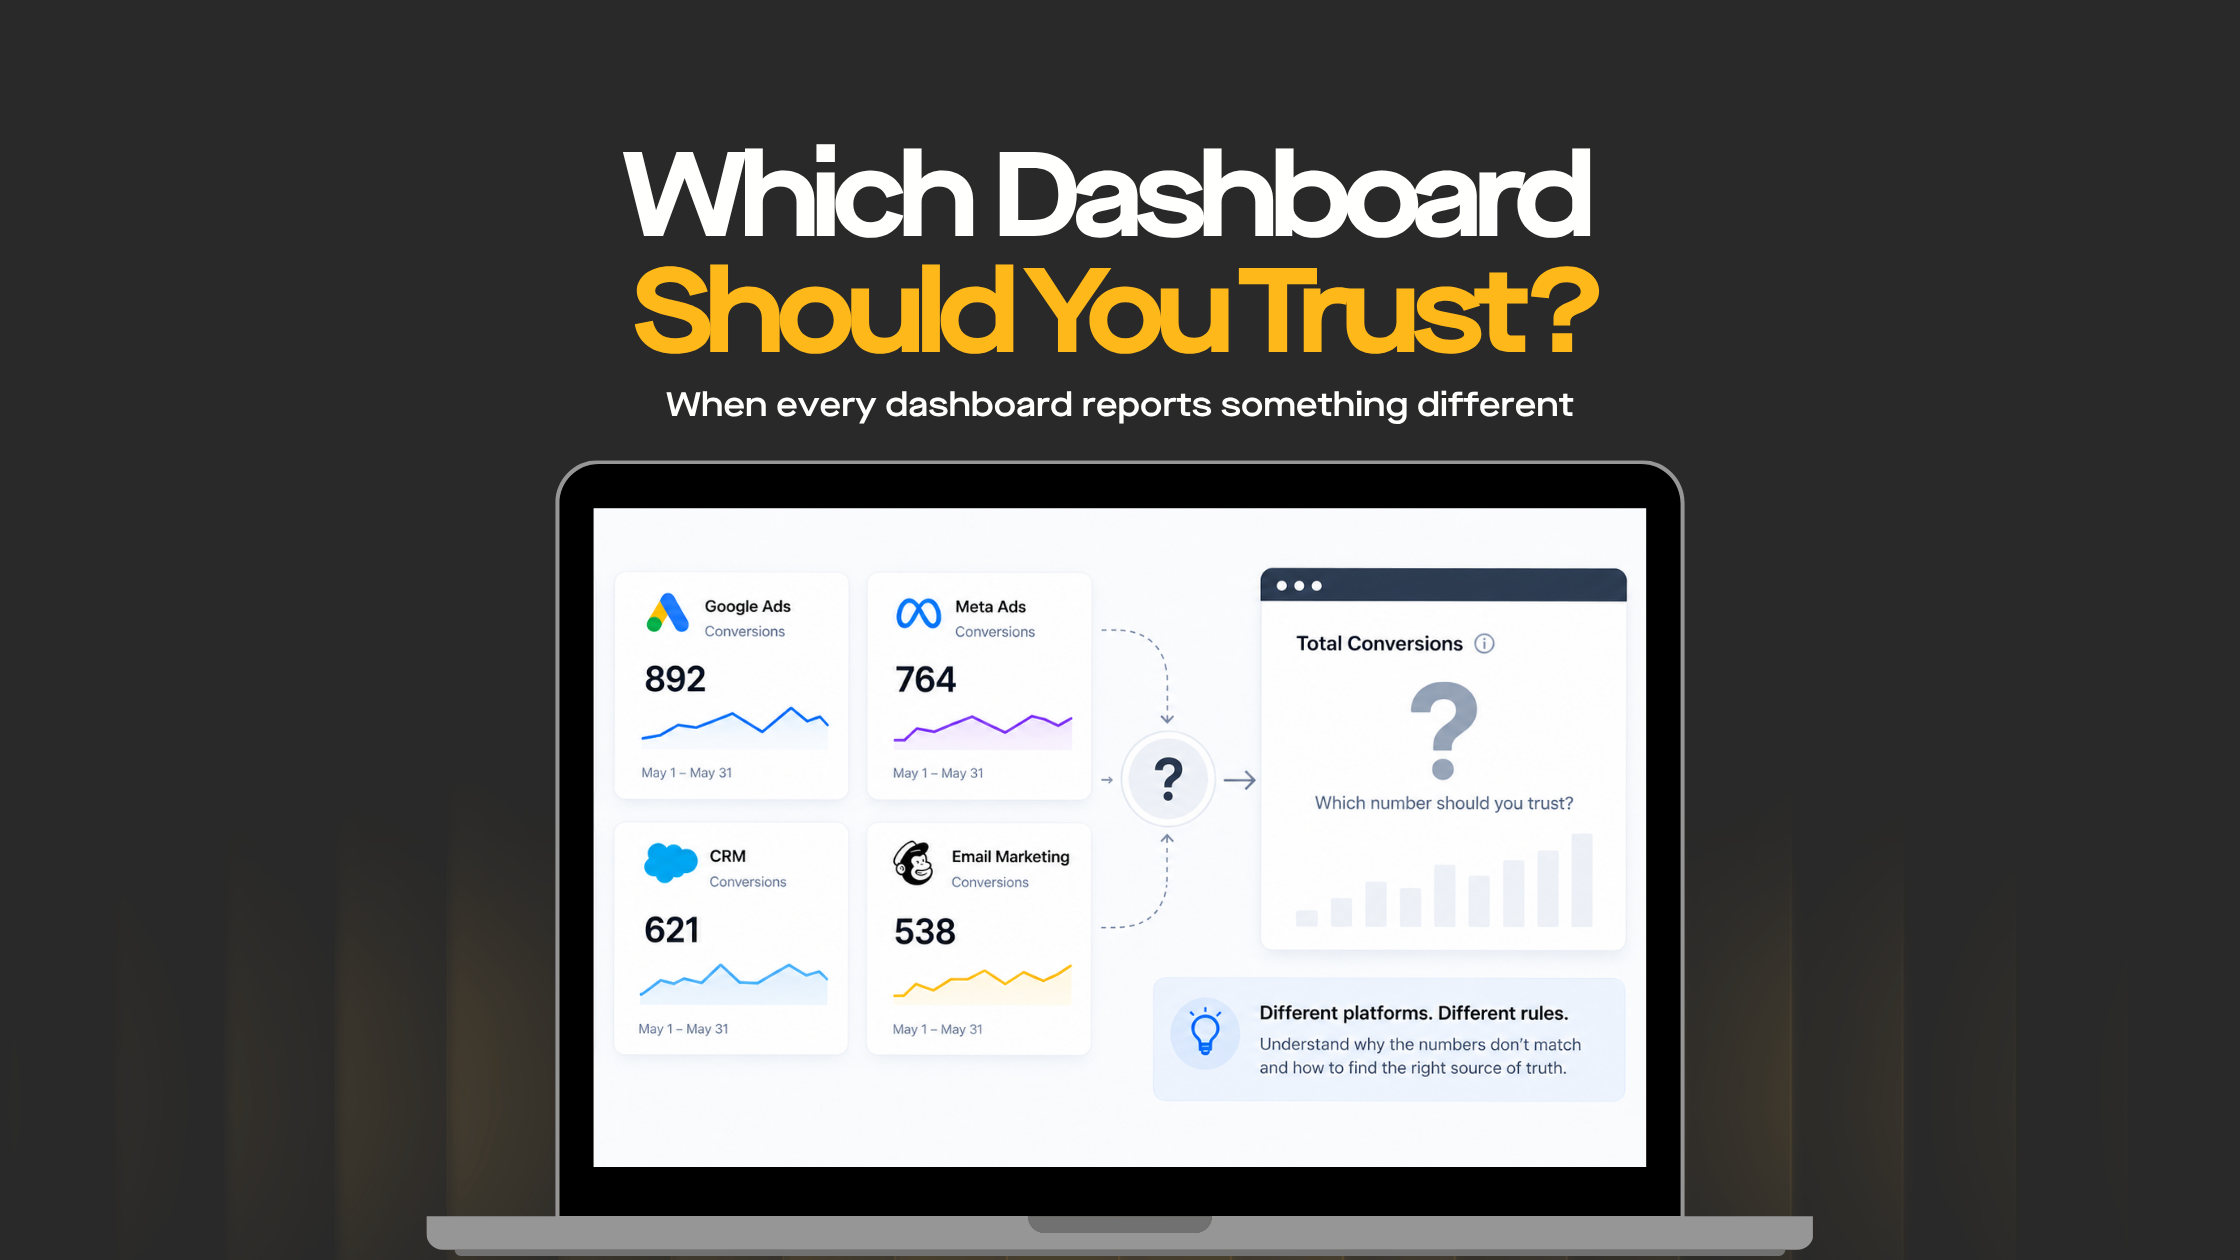
1. Direct Answer: Which Marketing Platform Data Should You Trust?
There is no single marketing platform that should automatically be trusted for every metric.
The better approach is to first decide what the business is trying to understand, then use the system closest to that outcome. Advertising platforms are useful for spend, delivery and platform metrics. GA4 is better suited to website traffic, content engagement and the conversion path. CRM data becomes more relevant once leads enter qualification and sales processes, while transactional and finance systems provide stronger evidence when the question is about orders or recognised revenue.
Some measures require several systems to work together. Customer Acquisition Cost may combine media spend with customer outcome data. Lifetime value often depends on customer relationship management, transactional and financial data collected over time.
A useful decision sequence is:
Question → Metric → Source → Attribution → Validation → Governance
The purpose is not to make every dashboard agree. It is to make sure the number being used is fit for the decision.
2. Why Marketing Dashboards Show Different Numbers
There are legitimate reasons why marketing dashboards show different numbers. Attribution models, attribution windows, timezone settings, filters, consent behaviour, user identification, cross-device activity and different conversion-counting rules can all change what appears in a report.
The simpler explanation is often that the platforms are measuring different stages of the journey.
A lead-generation conversion path might look like:
Ad interaction → Website visit → Form start → Form completion → CRM lead → Qualified opportunity → Customer
Each stage can produce a valid metric. Confusion starts when a form submission, CRM lead, qualified opportunity and customer are all described as “conversions” and then compared as though they represent the same outcome.
As a simple illustration, imagine Google Ads reports 120 conversions, GA4 records 95 website conversion events and the CRM contains 78 valid leads.
That gap does not necessarily mean data has disappeared. Google Ads may be reporting conversions it attributed to advertising interactions. GA4 may be recording conversion data generated on the website. The CRM may only contain valid records after spam, duplicates, internal enquiries or unsuccessful submissions have been removed.
Attribution can widen that difference further. A customer might first discover the brand through social media, return later through organic search, engage with Email Marketing and eventually click a paid search ad before converting. Meta Ads Manager may recognise the earlier social interaction, Google Ads may assign credit to the later click, GA4 may represent the journey differently again, and the CRM may preserve another source.
Not every influence will receive equal credit. Social media engagement, email interactions and content engagement can contribute to the eventual decision without appearing as the final attributed source. Brand perception can influence that decision as well, even though it is much harder to represent inside a conventional attribution report.
The customer still converted once. The platforms are simply looking at that journey through different measurement rules.
This is why click-through rates, search impression share, impressions and other performance metrics can be valuable for managing marketing campaigns without automatically becoming the final measure of commercial success.
3. Which System Should Own Which Metric?
A clearer reporting model assigns each important KPI to the system best placed to measure it.
| Business question | Primary reporting source | Why |
| How much did we spend on Google Ads? | Google Ads | Closest record of Google media spend and delivery |
| How much did we spend on Meta? | Meta Ads Manager | Closest record of Meta media spend and delivery |
| How much website traffic did we generate? | Google Analytics | Designed to measure website and app activity |
| What did users do on the website? | Google Analytics | Provides behavioural, content engagement and conversion path data |
| How many website conversion events occurred? | Validated web analytics | Closest record of defined on-site actions |
| How many valid leads entered the business? | CRM | Represents accepted lead records |
| How many leads became qualified opportunities? | CRM | Tracks qualification and sales progression |
| How much pipeline was generated? | CRM | Closest record of opportunity value and status |
| How many orders were completed? | Ecommerce or backend system | Represents operational transaction records |
| What revenue was recognised? | Finance or transactional system | Closest record of the commercial outcome |
| Which channels influenced acquisition? | Governed attribution model | Requires agreed rules across touchpoints |
| What did acquiring a customer cost? | Integrated media + customer/revenue data | Requires acquisition cost and customer outcome data |
| What is the longer-term value of acquired customers? | CRM + transactional/finance data | Requires customer and revenue history |
The other systems still matter once a primary source has been chosen. They simply play a different role.
GA4 can help explain how a visitor reached the site and what happened before a lead was created. Advertising platforms provide useful platform metrics around media delivery, click-through rates, search impression share and attributed conversions. CRM data can show whether those leads progressed commercially, while finance or transactional systems can confirm what happened further down the journey.
This is where marketing analytics becomes more valuable than a collection of disconnected dashboards. The aim is to connect acquisition, behaviour, pipeline and revenue without pretending that every platform is measuring the same thing.
Post-acquisition information can also matter when the business is evaluating lifetime value. Customer Success data, Support Tickets, Net Promoter Score and Customer Satisfaction Score can provide useful context about whether acquired customers remain satisfied or valuable over time. Those measures answer a different question from campaign acquisition, so they should only be brought into the analysis when they genuinely help answer the business question.
4. What Are the Best Marketing Dashboard Tools?
Once metric ownership is clear, teams often move to another practical question: What are the best marketing dashboard tools?
There is no single answer because the right tool depends on what the organisation needs to bring together.
A marketing team mainly reporting on Google Analytics, Google Ads and campaign activity may be comfortable using Looker Studio. A business that needs deeper modelling, finance data or reporting across several departments may be better suited to Power BI, Tableau or Looker. Teams working heavily inside platforms such as HubSpot, Salesforce or Adobe may also use their native reporting capabilities as part of the wider reporting environment.
The software matters, but it comes after the measurement design.
If Google Ads, GA4 and the CRM use different definitions of a lead or conversion, putting those numbers into a more sophisticated dashboard will not resolve the disagreement. The reporting may look better, but the business still has three different interpretations of the same KPI.
When teams ask What are the best dashboard tools for marketing?, we would look beyond the interface and ask a few more practical questions:
- Which systems need to be connected?
- Which system owns each important metric?
- How much transformation or modelling is required?
- Does the business need campaign reporting only, or also CRM, pipeline, revenue and finance data?
- Can metric definitions be governed consistently?
- Can the people using the dashboard understand where each KPI comes from?
A simple dashboard built on well-defined data can be more useful than a sophisticated BI environment built on inconsistent measurement.
5. The 7 Best Marketing Dashboard Tools for 2026: What Should You Actually Compare?
A search for The 7 best marketing dashboard tools for 2026 will usually produce a feature-by-feature comparison. That can be useful, but the longest feature list does not necessarily tell you which platform will work best for your reporting environment.
Seven commonly considered options include:
| Dashboard tool | Where it can fit |
| Looker Studio | Accessible marketing, GA4 and campaign reporting |
| Power BI | Broader business intelligence, modelling and Microsoft environments |
| Tableau | Advanced visual analysis and larger reporting environments |
| Looker | Governed reporting and modelling around centralised data |
| HubSpot reporting | Marketing, CRM and pipeline reporting inside HubSpot |
| Salesforce reporting | Lead, opportunity and sales reporting inside Salesforce |
| Adobe reporting environments | Enterprise marketing, analytics and customer-experience reporting |
This is not a universal ranking from one to seven. The useful comparison is whether a platform fits the organisation’s data architecture and reporting requirements.
A smaller marketing team might care most about ease of use, campaign visibility and fast access to GA4 and advertising data. A larger organisation may need warehouse integration, governed datasets, complex transformations, user permissions and reporting that connects marketing with finance and sales.
The difference matters because a dashboard should support the measurement system rather than define it.
If revenue, leads or conversions have not been clearly defined before the dashboard is built, changing reporting tools simply moves the disagreement into another interface.
6. Reporting Trust Often Breaks Between Platforms
Some of the hardest reporting problems are not caused by GA4, the CRM or an advertising platform itself. They happen in the handoff between systems.
A campaign identifier may exist on the website but never reach the CRM. A lead may be created without its original UTM parameters. An order may be completed without being connected back to the customer record or the marketing source that influenced it.
The advertising platform can then report a conversion while the business cannot confidently connect that activity with pipeline or recognised revenue.
Data integration becomes the real issue at that point.
Good integration is not about collecting every possible field. It is about preserving the identifiers and relationships needed to follow the journey far enough to answer the business question.
The same challenge becomes more complex when acquisition includes partnership commerce or performance partnerships. Additional platforms, identifiers and commercial relationships create more opportunities for attribution or customer data to be lost between systems.
Leakage detection can be useful here. Rather than looking only at the final dashboard total, teams can compare the handoff between stages to see where data or customer records begin to drop out. Form starts can be compared with completion rates, completed submissions with CRM lead creation, and campaign conversion data with downstream orders or revenue.
That kind of marketing data analysis often reveals far more than simply comparing two headline totals.
A polished data visualization can hide the same problem. Looker Studio, Power BI, Tableau or another BI tool may combine Google Ads, Meta Ads Manager, GA4, CRM and finance data in one online dashboard, but bringing those sources together does not reconcile them automatically.
A leadership report may show one number labelled “Revenue” even though the advertising platform is reporting conversion value, ecommerce is reporting order value, the CRM is showing opportunity value and finance is reporting recognised revenue.
The visual can be perfectly clear while the definition underneath it remains unclear.
The best marketing dashboard tools make reporting easier to explore and use. They still depend on clear metric definitions, reliable data integration and agreement on which system owns each business outcome.
7. How to Reconcile Marketing Data Across Platforms
The most useful approach to how to reconcile marketing data across platforms is to begin with the decision rather than the numerical difference.
If the business wants to know which campaign generated the most website engagement, that may mainly be a GA4 question. If the question is which campaign generated the most profitable customers, the analysis is likely to require CRM, transactional and finance data as well.
Once the question is clear, define the metric. A form completion, valid lead, qualified opportunity, order and customer should not all be called a “conversion” without explaining the distinction.
Then choose the system closest to the outcome. That decision should be based on what the platform is designed to measure, not which connector happens to be easiest to add to a report.
Attribution should be treated separately. A completed transaction is a business event. Attribution is the method used to decide which marketing activity receives credit for that event. Keeping those concepts separate removes a large amount of unnecessary disagreement between GA4, Google Ads, Meta Ads Manager and CRM reporting.
Validation is where marketing data analytics and broader data analytics become particularly useful. Rather than looking at isolated totals, teams can compare the relationships between website traffic, form starts, completion rates, CRM leads, opportunities and revenue.
If website traffic and form starts remain steady but completion rates suddenly decline, there may be an issue with the form experience, tracking or a recent A/B testing variation. If website conversions rise while CRM leads fall, the problem may sit in lead processing or data integration. If media activity, website behaviour, CRM outcomes and transactions all move in the same direction, there is stronger evidence that the performance change is genuine.
The final step is governance. Metric definitions, ownership, filters and calculations need to be documented so that another analyst, agency or reporting tool does not recreate the same KPI using different logic.
Reconciliation does not mean making every platform show an identical number. It means being able to explain why the numbers differ and knowing which one should guide the decision.
8. When Should a Difference Be Investigated?
Not every reporting difference needs to be fixed.
A consistent gap between Meta Ads Manager and GA4 may be completely normal if the platforms use different attribution methods and observe different parts of the journey. The more important signal is usually a change in that relationship.
If one platform has historically reported somewhat more attributed conversions than another and the reason is understood, there may be nothing to fix. If the gap suddenly becomes materially larger without a corresponding change in the campaign, attribution settings or business performance, it deserves investigation.
There are other useful clues. Analytics and CRM outcomes may suddenly move in different directions. UTM parameters can disappear. A conversion event may begin firing twice. A GTM publish may coincide with a change in reported performance. Cross-domain tracking, server-side tracking and consent configuration can also affect what reaches the platforms.
Website releases and A/B testing deserve the same attention. A new form, landing-page variation or change in the conversion path can alter event behaviour or completion rates without the marketing campaigns themselves becoming less effective.
GTM strategies should also include change control and post-release validation. Tags, triggers, data-layer logic and server-side configuration can all affect conversion data after a release, so implementation history should form part of the investigation when numbers move unexpectedly.
Consent changes and privacy regulations can alter what analytics and advertising platforms are able to observe. An IP Address, for example, should not be treated as a universal customer identifier across systems, so reporting needs to acknowledge the limits of what can actually be measured.
What matters is whether the relationship between the numbers can still be explained.
9. Where AI Can Help
Artificial intelligence can help teams investigate cross-platform discrepancies faster once the underlying measurement is stable.
AI-driven anomaly detection can surface unusual movements in conversion rates, platform metrics, CRM lead volume, pipeline or revenue. Newer agentic AI and agentic analytics approaches may extend this by allowing AI agents to compare governed data across several systems and identify where a reporting gap begins.
An AI chat platform or AI search interface can make those findings easier to explore, particularly where reliable data integration and workflow integration are already in place. AI/ML capabilities can also support wider marketing data analytics by highlighting changes that might otherwise be missed in a standard reporting review.
There is still an important limitation. AI can identify that two numbers disagree, but it cannot decide what the business means by “qualified lead” if that definition has never been agreed. The quality of the analysis still depends on the quality of the underlying data and governance.
This becomes more important as organisations invest in Data Architecture Modernization and move towards a Real-Time Enterprise model. Faster access to information can improve decision-making, but it does not resolve inconsistent definitions. As reporting becomes more connected and automated, ownership across marketing, analytics, sales, Customer Success, the support team and finance becomes more important.
10. DIGITXL Point of View: Build Measurement Confidence, Not Perfect Agreement
At DIGITXL, a martech agency, we see conflicting dashboards as a measurement-confidence problem before we see them as a reporting-design problem.
The objective is not to make Google Ads, GA4, the CRM and finance all display the same number. They are measuring different parts of the journey and, in many cases, should not match exactly.
What matters is whether marketing, sales and leadership know which number should be used for a particular decision and can explain why another system may report something different.
That changes the role of the dashboard.
Instead of being treated as the place where truth is created, the dashboard becomes the place where agreed measurement logic is presented.
When we approach a reporting problem, we normally start with the business decision, define the metric, identify the system closest to the outcome and then validate how that number relates to the surrounding systems.
The reporting tool comes after that.
Looker Studio, Power BI, Tableau, Looker or another platform can all be useful depending on the reporting environment. None of them can compensate for unclear definitions, broken integrations or inconsistent ownership underneath the dashboard.
A stronger measurement foundation also makes data analytics, agentic analytics and automated decision workflows more useful. Technology becomes far more valuable once the business understands what the important signals actually mean.
11. Final Thoughts
When Google Ads, GA4, Meta Ads Manager, the CRM and the executive dashboard disagree, choosing one platform and ignoring the others is rarely the answer.
Start with the business question. Work out what the metric actually represents and which system is best placed to measure it. Then use the surrounding platforms to understand the conversion path, attribution, lead progression and eventual commercial outcome.
The dashboard is the reporting layer sitting on top of that logic.
So if you are evaluating what are the best marketing dashboard tools, do not start with the longest feature list. Start with the systems, metrics and decisions the dashboard needs to support.
A good dashboard makes an established measurement model easier to use. It should not be responsible for inventing the model.
At the next reporting review, take one important KPI and ask whether everyone in the room can explain what it means, where it comes from, who owns it and why another platform may report a different number.
If the team cannot answer that clearly, the problem is probably deeper than the dashboard.
If inconsistent reporting is making marketing decisions harder, DIGITXL, an SEO Agency and analytics partner, can help review the measurement journey., clarify metric ownership, validate tracking and data integration, strengthen GTM strategies and build reporting that connects marketing activity with the business outcomes it is meant to influence.

 Previous