- Digital Analytics
How to Push Custom Dimensions and Events in Looker Studio?
28 Jan 2025
Data visualisation is a critical component of modern business strategy, helping organisations make sense of their data to drive informed decisions. Looker Studio (formerly Google Data Studio) has emerged as a versatile and user-friendly tool for creating dynamic dashboards and insightful reports. While it works seamlessly with built-in dimensions and metrics from sources like Google Analytics 4 (GA4), the real power of Looker Studio lies in its ability to incorporate custom dimensions and custom events.
Whether you manage everything in-house or collaborate with an Analytics agency, using these features correctly can significantly improve the quality of your reporting.
Custom dimensions allow you to track unique attributes specific to your business, such as membership levels or product categories, while custom events provide insights into specific user interactions like video plays or form submissions. By pushing these customised metrics into Looker Studio, you can create tailored reports that go beyond standard data, offering deeper insights and greater flexibility.
In this guide, we’ll walk you through the step-by-step process of defining, implementing, and visualising custom dimensions and events in Looker Studio. Whether you’re looking to understand customer behaviour, track conversions, or create KPI-specific dashboards, this comprehensive guide will help you unlock the full potential of your data.
1. Define and Implement Custom Dimensions and Events in GA4
- Plan Your Custom Dimensions and Events
Before starting, determine the key actions and attributes you want to track. For instance:- Custom Dimensions: Membership tier, product category, user type (e.g., free or premium).
- Custom Events: Form submissions, purchases, clicks on specific buttons, and video plays.
- Set Up Custom Dimensions in GA4
- Log in to your GA4 account.
- Go to Admin > Custom Definitions > Custom Dimensions.
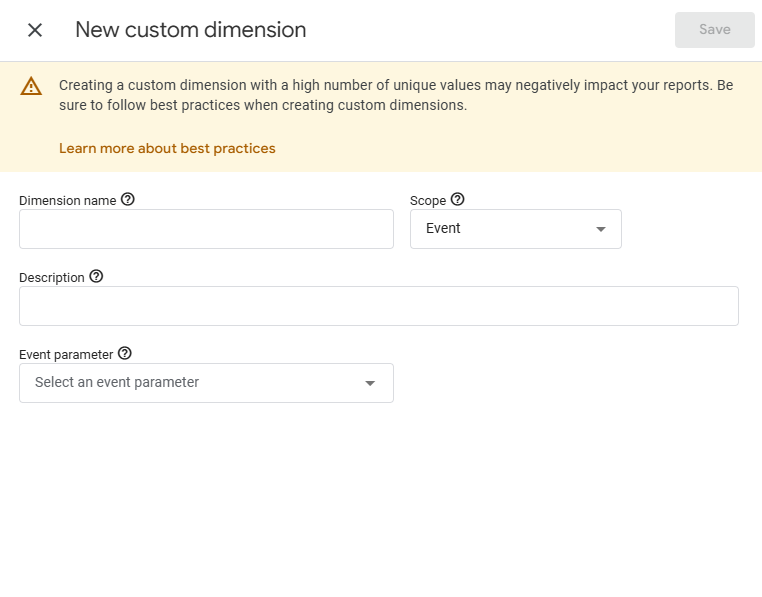
- Click Create Custom Dimension and provide:
- Name: A descriptive name (e.g., “Membership Tier”).
- Scope: Choose Event or User, depending on your needs.
- Parameter Key: Match this with the event parameter you’ll be passing via Google Tag Manager (GTM) or directly through your website’s code.
- Implement Custom Events in GA4
- If you’re using GTM:
- Go to your GTM account and create a new Tag.
- Choose Google Analytics: GA4 Event as the tag type.
- Add the Event Name (e.g., “Video_Play”) and configure Event Parameters (e.g., video title, duration).
- Set up a trigger for the event (e.g., clicking a play button).
- Publish the changes.
- Test the implementation using Preview Mode in GTM to ensure the events are firing correctly.
- If you’re using GTM:
- Verify in GA4
Navigate to Realtime Reports in GA4 or use DebugView to confirm the custom events and dimensions are being tracked as expected.
2. Connect Your Data Source to Looker Studio
- Open Looker Studio
- Go to Looker Studio and log in using your Google account.
- Add Your Data Source
- Click on Create > Data Source.
- Select the appropriate connector (e.g., Google Analytics).
- Authorise the Connection
- Grant Looker Studio access to your Google Analytics account.
- Select Your GA4 Property
- Choose the property where your custom dimensions and events are implemented.
- Verify Data Fields
- Review the available fields in Looker Studio to ensure your custom dimensions and events appear. If they don’t, ensure you’ve properly configured them in GA4 and given them enough time to populate.
3. Add Custom Dimensions in Looker Studio
- Locate Custom Dimensions
- Go to the Data Panel in Looker Studio.
- Check if your custom dimensions are available in the Dimensions list.
- Create New Fields (If Needed)
- If you need to modify or calculate fields, click Add a Field.
- Use formulas to create calculated dimensions. For example:
Group specific events into categories:
CASE
WHEN Event_Name = “purchase” THEN “Completed Purchase”
WHEN Event_Name = “add_to_cart” THEN “Cart Activity”
ELSE “Other”
END
- Visualise Custom Dimensions
-
- Drag the custom dimension into your report visualisation, such as a table, pie chart, or heatmap.
4. Add Custom Events in Looker Studio
- Identify Custom Events
- Locate the Metrics panel and search for your custom events.
- Incorporate Event Parameters
- Some events, such as product details or user actions, may have additional parameters. Ensure these are visible in the data source fields.
- Create Calculated Metrics for Events
If you need a metric to count occurrences of specific events, create a calculated field:
COUNTIF(Event_Name = “video_play”) - Add Filters for Event-Specific Reporting
- Use filters to refine visualisations. For example, create a filter to show only purchase-related events:
- Filter: Event_Name = “purchase”.
- Use filters to refine visualisations. For example, create a filter to show only purchase-related events:
5. Customise Visualisations
- Build Tailored Dashboards
- Add a Chart or Table to your report.
- Set the Dimension to your custom dimension (e.g., Membership Tier).
- Set the Metric to your custom event count or other calculated metrics.
- Design for Clarity
- Use labels and descriptions for your charts to make reports more intuitive for stakeholders.
- Highlight key metrics with conditional formatting (e.g., high engagement rates in green).
- Enable Filters and Controls
- Add interactive controls like date ranges, dropdown filters, or sliders to allow users to explore custom data dynamically.
6. Test and Refine
To ensure the custom dimensions, events, and reports are working as intended, thorough testing and refinement are essential. This step not only validates the accuracy of the data but also ensures that the insights derived are actionable and easy to interpret.
1. Validate Your Custom Dimensions and Events
- Cross-check with GA4: Open GA4 and compare the data for your custom dimensions and events with what is displayed in Looker Studio.
- Check event counts to ensure consistency.
- Validate custom dimension values (e.g., membership tiers or product categories) against raw GA4 data.
- Debugging in Looker Studio:
- Use the “View Data” option in Looker Studio to see raw data in tables.
- Ensure custom events and parameters are populating correctly without null or missing values.
- Test Filters and Segments: If you’ve set up filters (e.g., for specific event names or dimension values), confirm they are filtering data as expected.
2. Test for Performance
- Check Dashboard Loading Time: Large datasets or complex calculated fields can slow down report performance. Optimise the data source by:
- Limiting unnecessary fields in the data connector.
- Simplifying calculated fields where possible.
- Test Across Devices: Ensure the dashboard performs well on desktop, tablet, and mobile devices. Looker Studio dashboards are responsive, but verify visualisation clarity on smaller screens.
3. Gather Stakeholder Feedback
- Share the Dashboard: Invite key stakeholders (e.g., marketing teams, analysts, or decision-makers) to review the report.
- Solicit Feedback on Key Metrics: Ask if the metrics and dimensions displayed align with their needs. For example:
- Are custom events providing enough actionable insight?
- Are dimensions broken down in a way that’s meaningful to them?
- Iterate Based on Feedback: Based on suggestions to improve usability and clarity, refine the charts, filters, and overall report design.
4. Refine Visualisations and Calculated Fields
- Simplify Complex Calculations: If stakeholders find certain metrics confusing, rework calculated fields into simpler, more descriptive terms.
- Update Visualisation Types: Experiment with different visualisation styles to make insights clearer:
- Replace a table with a bar chart for easier trend analysis.
- Add pie charts to represent proportions for custom dimensions like user types or regions.
- Conditional Formatting: Use colour-coded metrics to highlight significant trends, such as high-performing events or areas needing improvement.
5. Enable Dynamic Controls
- Date Ranges: Add a date range selector to allow stakeholders to view data for specific periods.
- Dropdown Filters: Include filters for dimensions such as user type, product category, or regions to make the report interactive.
- Drill-Down Options: Allow users to drill down into specific dimensions or events for a more granular view. For instance, clicking on “Video Plays” could reveal video-specific engagement metrics.
6. Automate Reporting
- Schedule Email Delivery: Set up scheduled email reports to share updated dashboards with stakeholders regularly.
- Real-Time Updates: Ensure the data connector syncs regularly to keep reports up-to-date.
- Version Control: Save different versions of your dashboard to track changes and revert to previous versions if needed.
7. Monitor and Improve Over Time
- Track Engagement with the Dashboard: Use Looker Studio’s built-in analytics to monitor which parts of the dashboard stakeholders interact with most frequently.
- Expand Functionality: Over time, consider adding additional dimensions, metrics, or events as your business requirements evolve.
- Incorporate New Data Sources: If new data becomes available (e.g., CRM or sales data), blend it with your existing data source for richer insights.
7. Key Takeaway
Testing and refining your dashboard ensures that it remains an effective tool for decision-making. By validating data accuracy, improving report performance, and incorporating stakeholder feedback, you can create a Looker Studio report that delivers consistent value to your team.
If you’re unsure how to streamline your reporting or want a professional consultation, contact Digitxl for expert support! We can help you fine-tune your analytics setup for maximum impact.
8. FAQ

Recent Posts


Case Studies
Business News Australia
On Track Meals


