- Adobe Analytics
- Data Analytics
- Digital Analytics
- Google Analytics
How to Audit Your Digital Analytics Stack: Tools and Processes
03 Jul 2025
A regular digital analytics audit helps uncover redundancies and improve decision-making.
Your company probably has 12+ analytics tools right now. Maybe you know about 8 of them. You definitely use 4 regularly. And you’re pretty sure 3 of them do the exact same thing.
Time for an analytics stack audit. If you’re not sure where to start, DIGITXL has done this teardown dozens of times as an analytics agency with frameworks built for enterprise complexity.
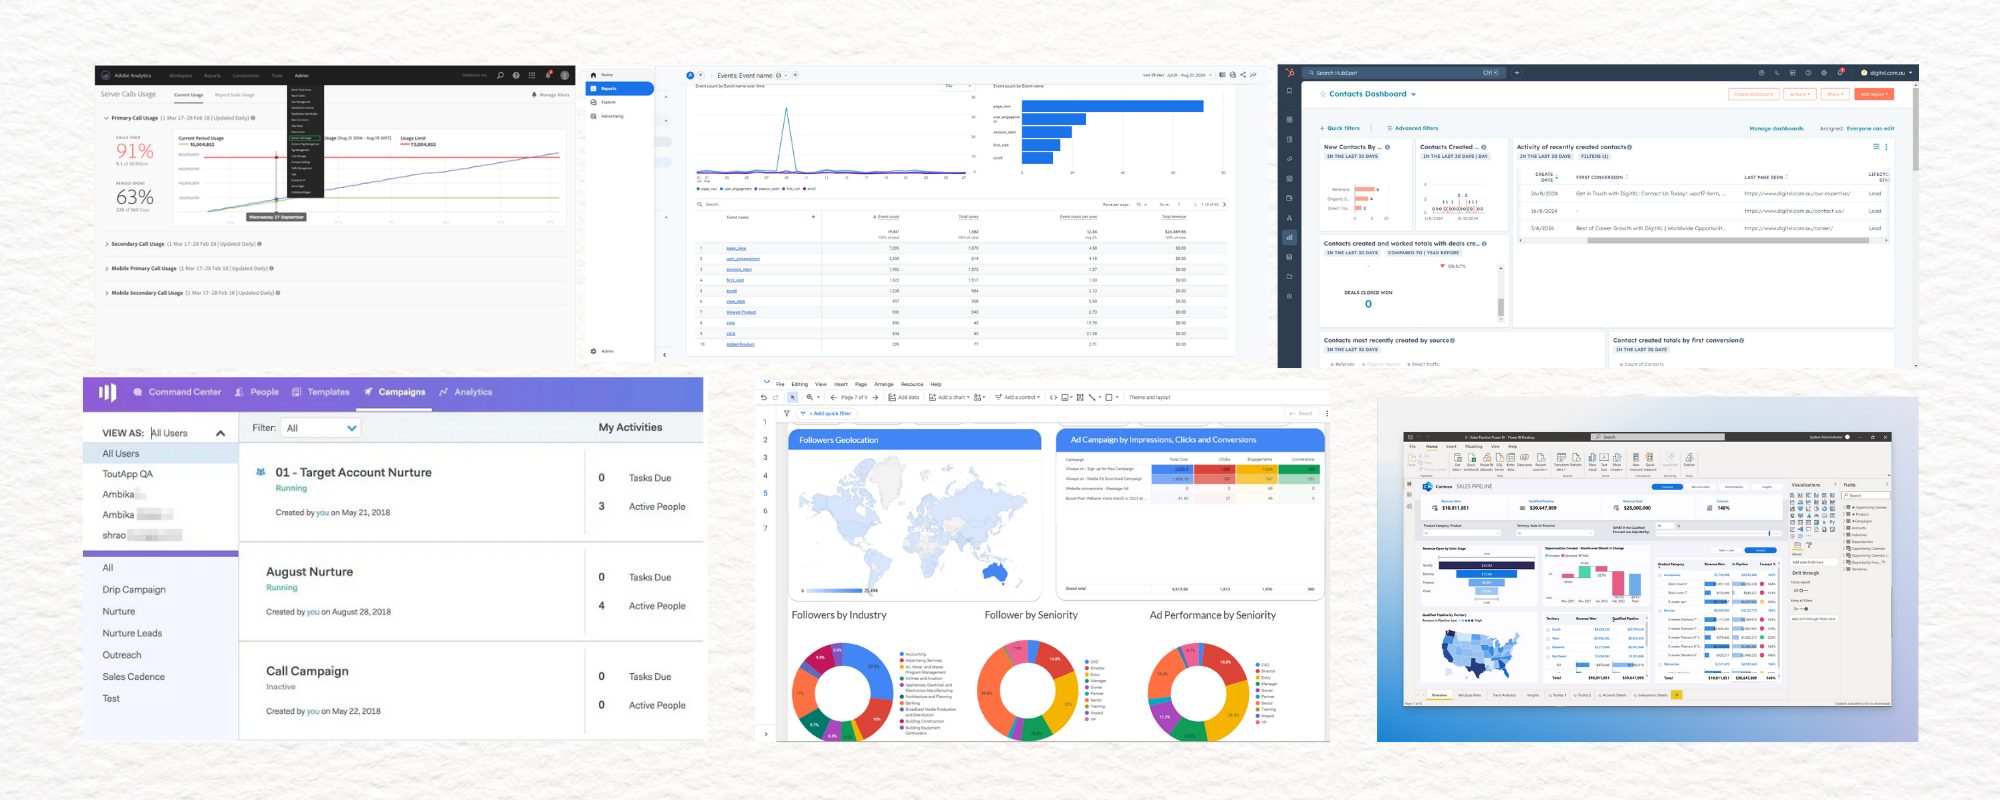
1. Analytics Dashboards
2. What Is Your Analytics Stack Anyway?
Your Analytics stack is every tool that collects, processes, or reports on your digital data.
Most companies add tools over time without thinking about how they work together. That’s why you need an audit. A Martech audit can reveal how well these tools align with your growth strategy.
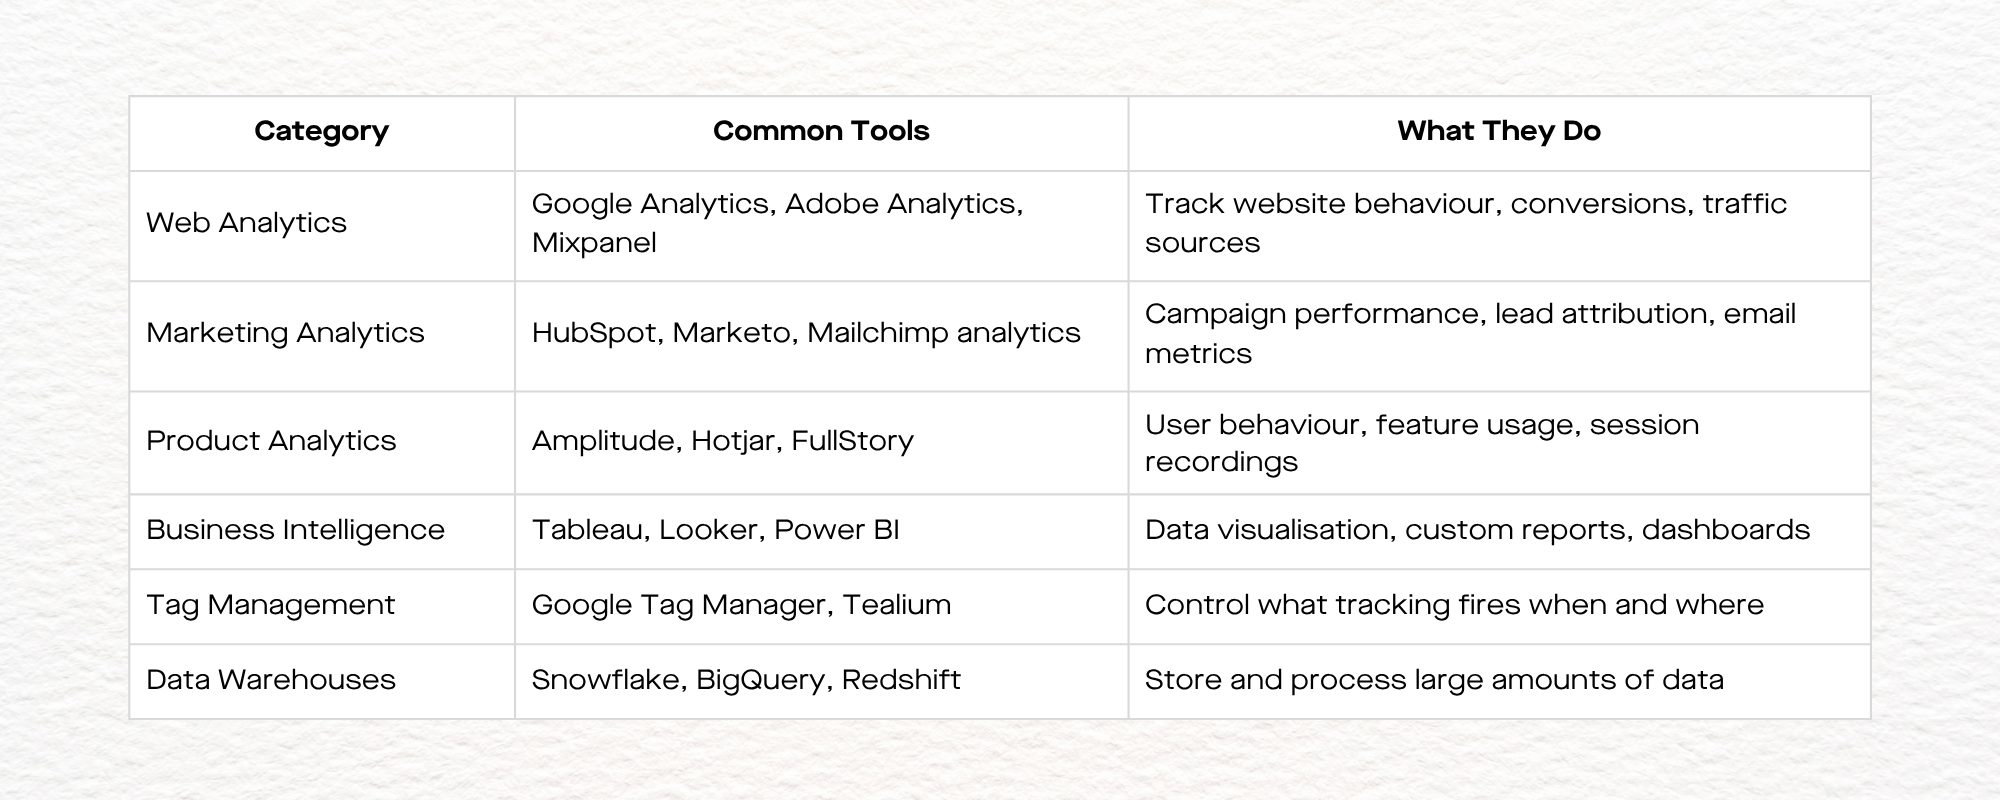
The typical stack includes:
3. The 4-Phase Analytics Stack Audit Process
3.1 Phase 1: Inventory Everything (Week 1)
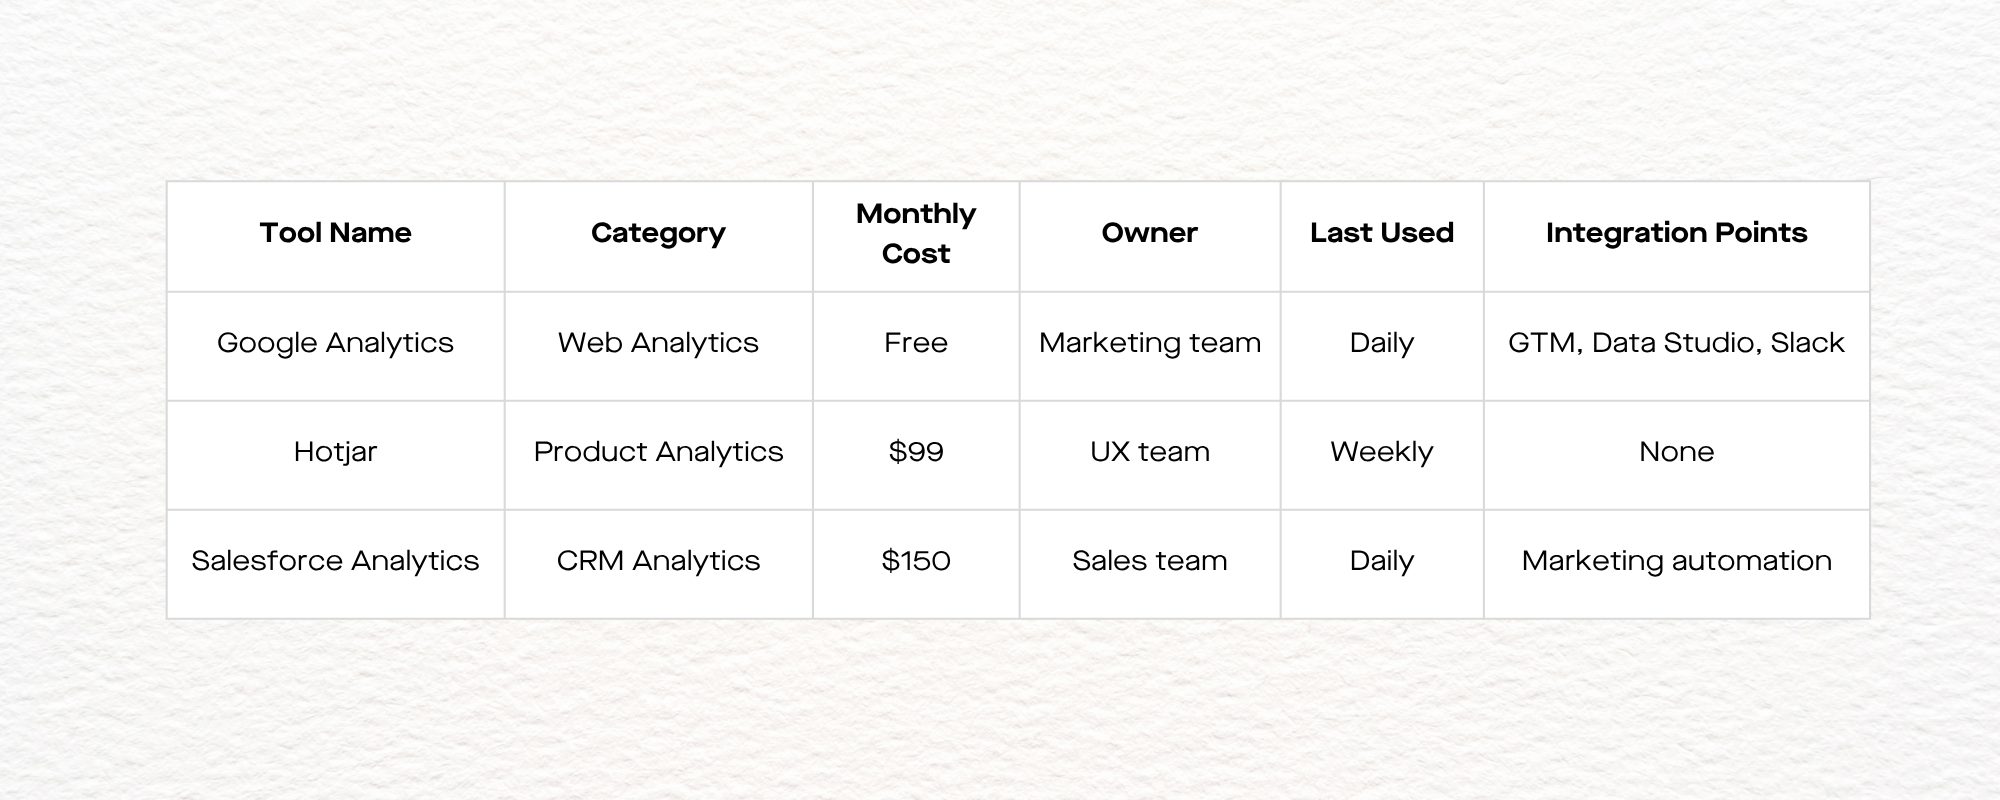
Step 1: Create the master list
Build a spreadsheet with these columns:
Step 2: Find the hidden tools
Check these places for forgotten analytics:
- Your company’s SaaS management tool
- Credit card statements for software subscriptions
- Browser bookmarks in the marketing folder
- Old email confirmations for free trial signups
Review which marketing analytics platforms provide actual value.
IT’s list of approved software
Step 3: Map your data flow
Draw how data moves between tools:
Website → Google Tag Manager → Google Analytics → Data Studio
↓
Email campaigns → Mailchimp → Zapier → CRM
↓
Social ads → Facebook Analytics → Manual export → Spreadsheet
Messy diagram = messy stack.
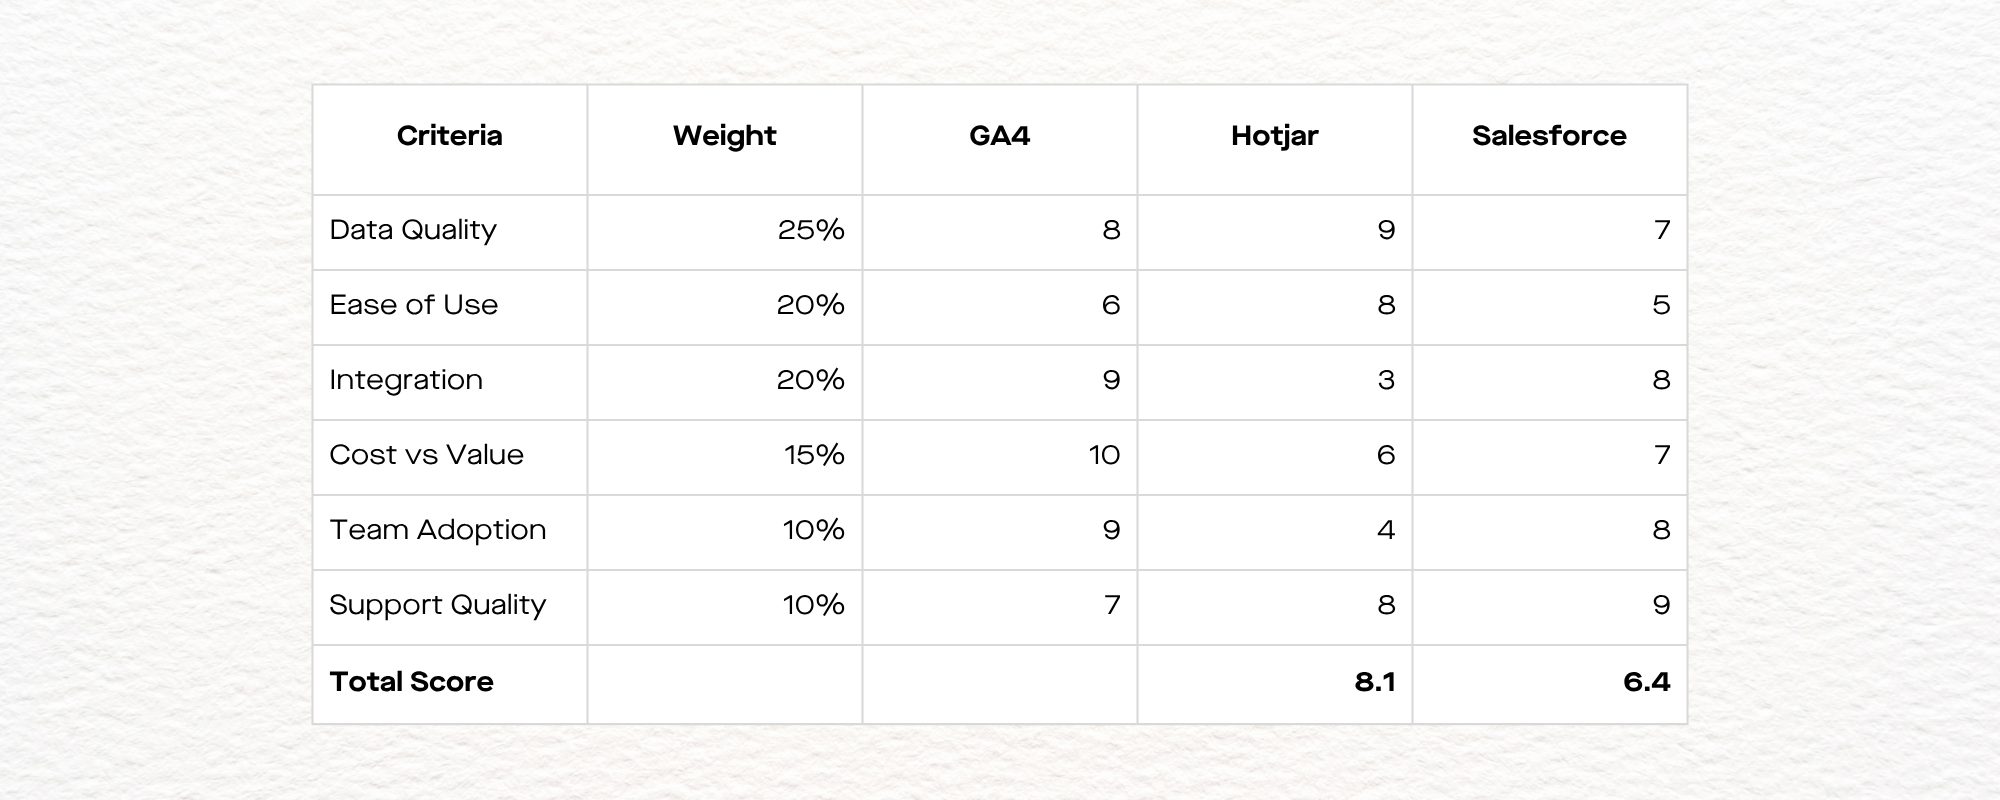
3.3 Phase 2: Evaluate Each Tool (Week 2)
The Tool Scorecard – Rate each tool 1–10
Key questions for each tool:
- What decisions have you made based on this data in the last 3 months?
- How much time does your team spend on this tool weekly?
- Could you get the same insights from a tool you already have?
- Is the data accurate and trustworthy?
Be mindful of data quality issues that may arise from inconsistent tracking. - Does it integrate well with your other tools?
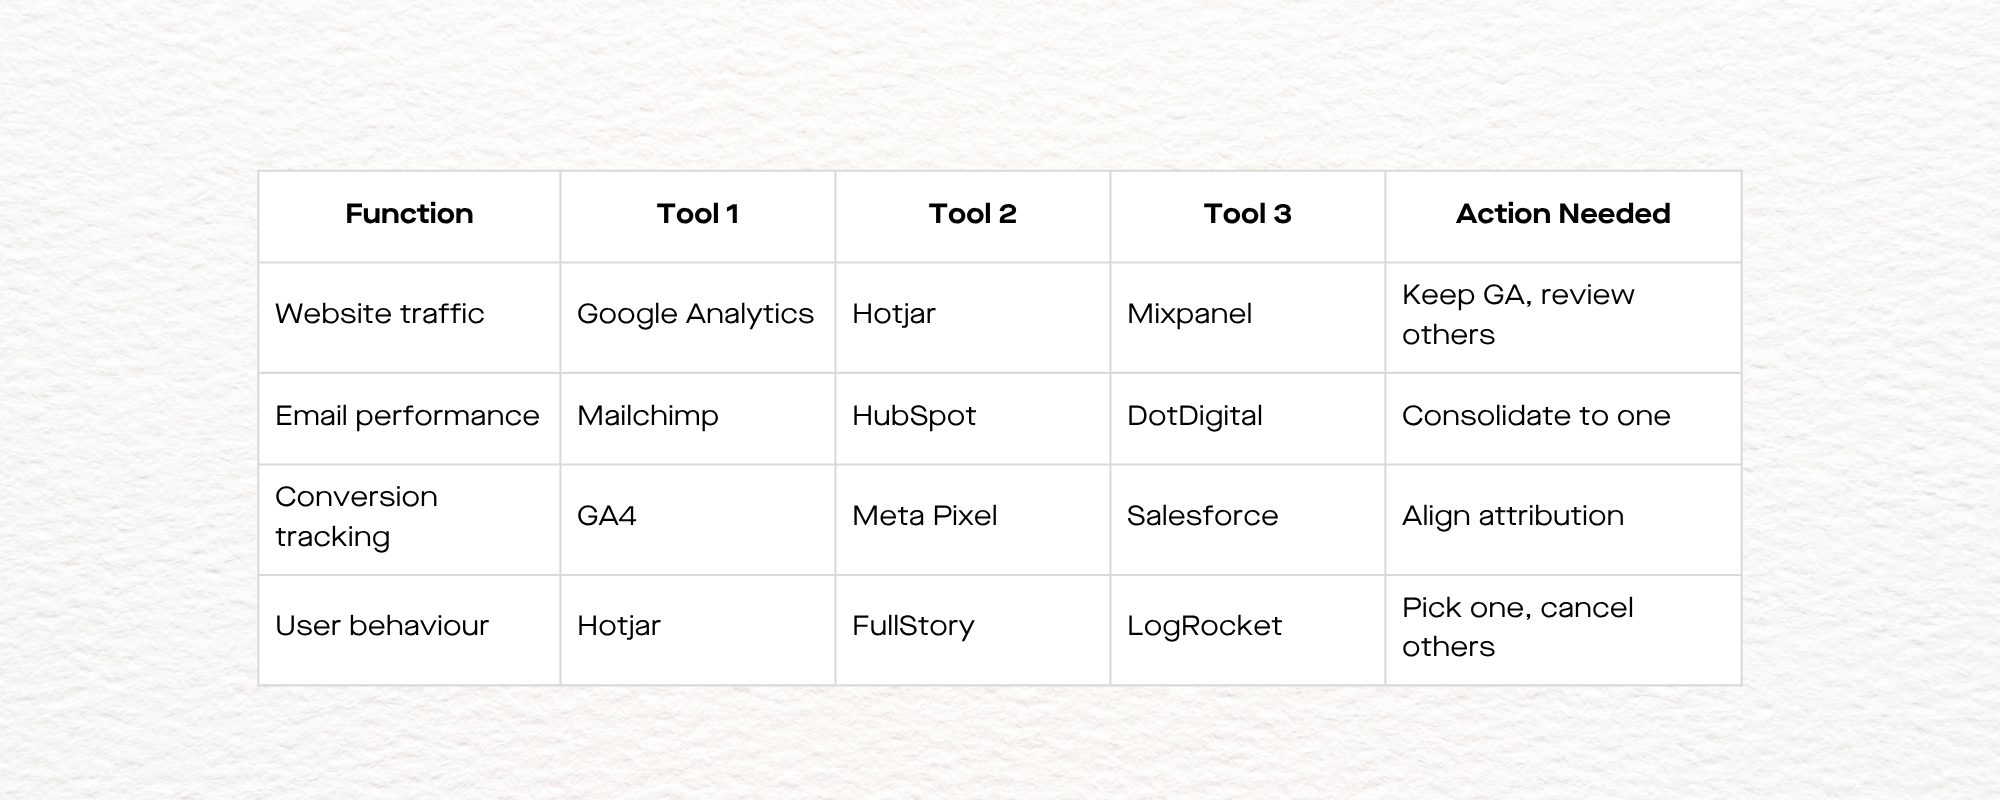
3.4 Phase 3: Identify Gaps and Overlaps (Week 3)
Find the overlaps
Identifying tool overlap in analytics can significantly reduce platform costs.
Find the gaps
Common missing pieces:
- Customer lifetime value tracking
- Cross-device attribution
- Real-time alerting for issues
- Automated report generation
- Data quality monitoring
The integration nightmare check
How many manual steps to create your monthly report?
- Export from Google Analytics: Manual
- Export from Facebook Ads: Manual
- Export from email platform: Manual
- Combine in Excel: Manual
- Format for presentation: Manual
This highlights the need for reliable automated reporting tools.
If you counted more than 2 manual steps, you have an integration problem.
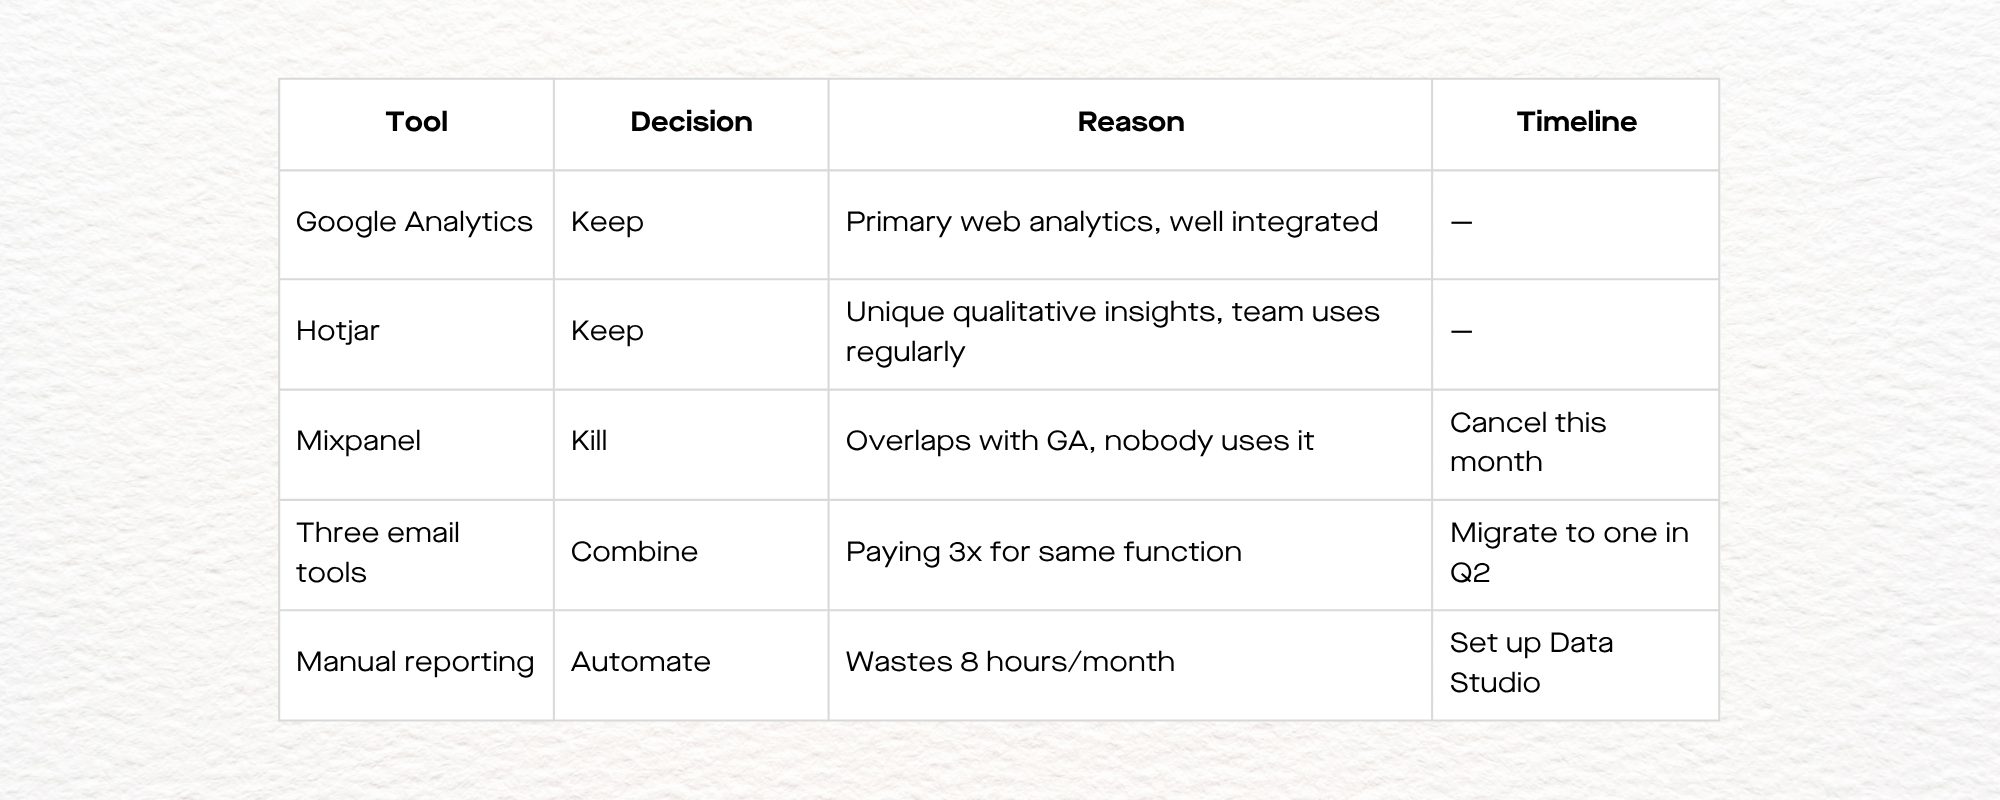
3.5 Phase 4: Create Your Optimisation Plan (Week 4)
The Keep/Kill/Combine Matrix
Your action priorities:
Quick Wins (This Month)
- Cancel unused tools
- Consolidate duplicate functions
- Set up basic integrations
- Train teams on remaining tools
Medium-term (Next Quarter)
- Implement tag management system
- Build automated reporting
- Fill critical data gaps
- Establish data governance
Long-term (Next 6 Months)
- Advanced attribution modelling
- Predictive analytics setup
- Cross-platform customer journey
AI-powered insights
Start by optimising analytics tools already in your stack before adding more.
4. Common Audit Findings
- The “Tool Graveyard”
40% of analytics tools haven’t been used in 3+ months
→ Cost impact: $200–2000/month in wasted subscriptions - The “Integration Desert”
60% of tools don’t talk to each other
→ Time impact: 10–20 hours/month in manual work - The “Data Contradiction Crisis”
Same metrics differ by 20–50% across tools
→ Strategy impact: Wrong decisions from bad data
The “Access Chaos”
30% of tool access belongs to ex-employees
→ Security impact: Risk of breaches, compliance issues
5. Your Stack Audit Toolkit
Free Tools:
- Google Sheets for inventory and scoring
- Zapier for quick integration testing
- Google Tag Manager for tracking code management
- Browser developer tools for technical audits, especially useful during a Google Analytics audit.
Paid Tools Worth Considering:
- Segment for data integration ($120+/month)
- Supermetrics for automated reporting ($99+/month)
- Looker Studio Pro for advanced visualisation ($20/month)
6. The Monthly Stack Health Check
Monthly Review Checklist:
- Are all tools being used regularly?
- Any new tools added without approval?
- Integration points still working?
- Any new data quality issues?
- Team feedback on performance?
- Any cost changes or upcoming renewals?
Quarterly Deep Dive:
- ROI analysis on each tool
- New tools needed for business growth?
- Consolidation opportunities?
- Team training gaps?
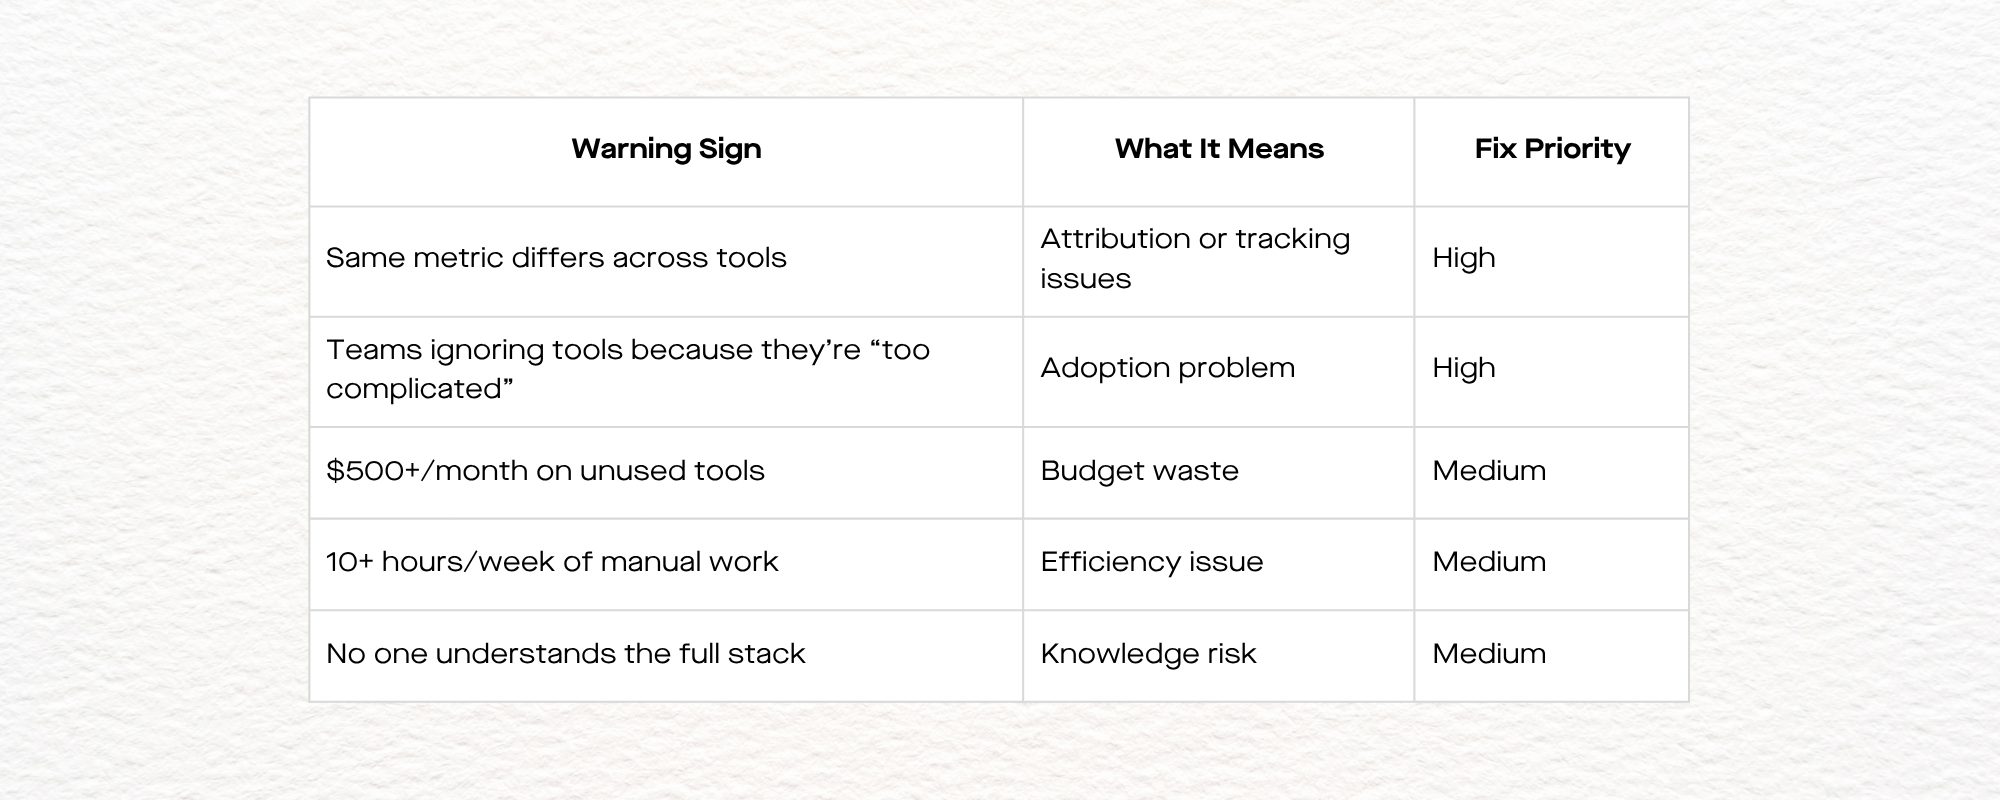
7. Red Flags That Demand Immediate Action
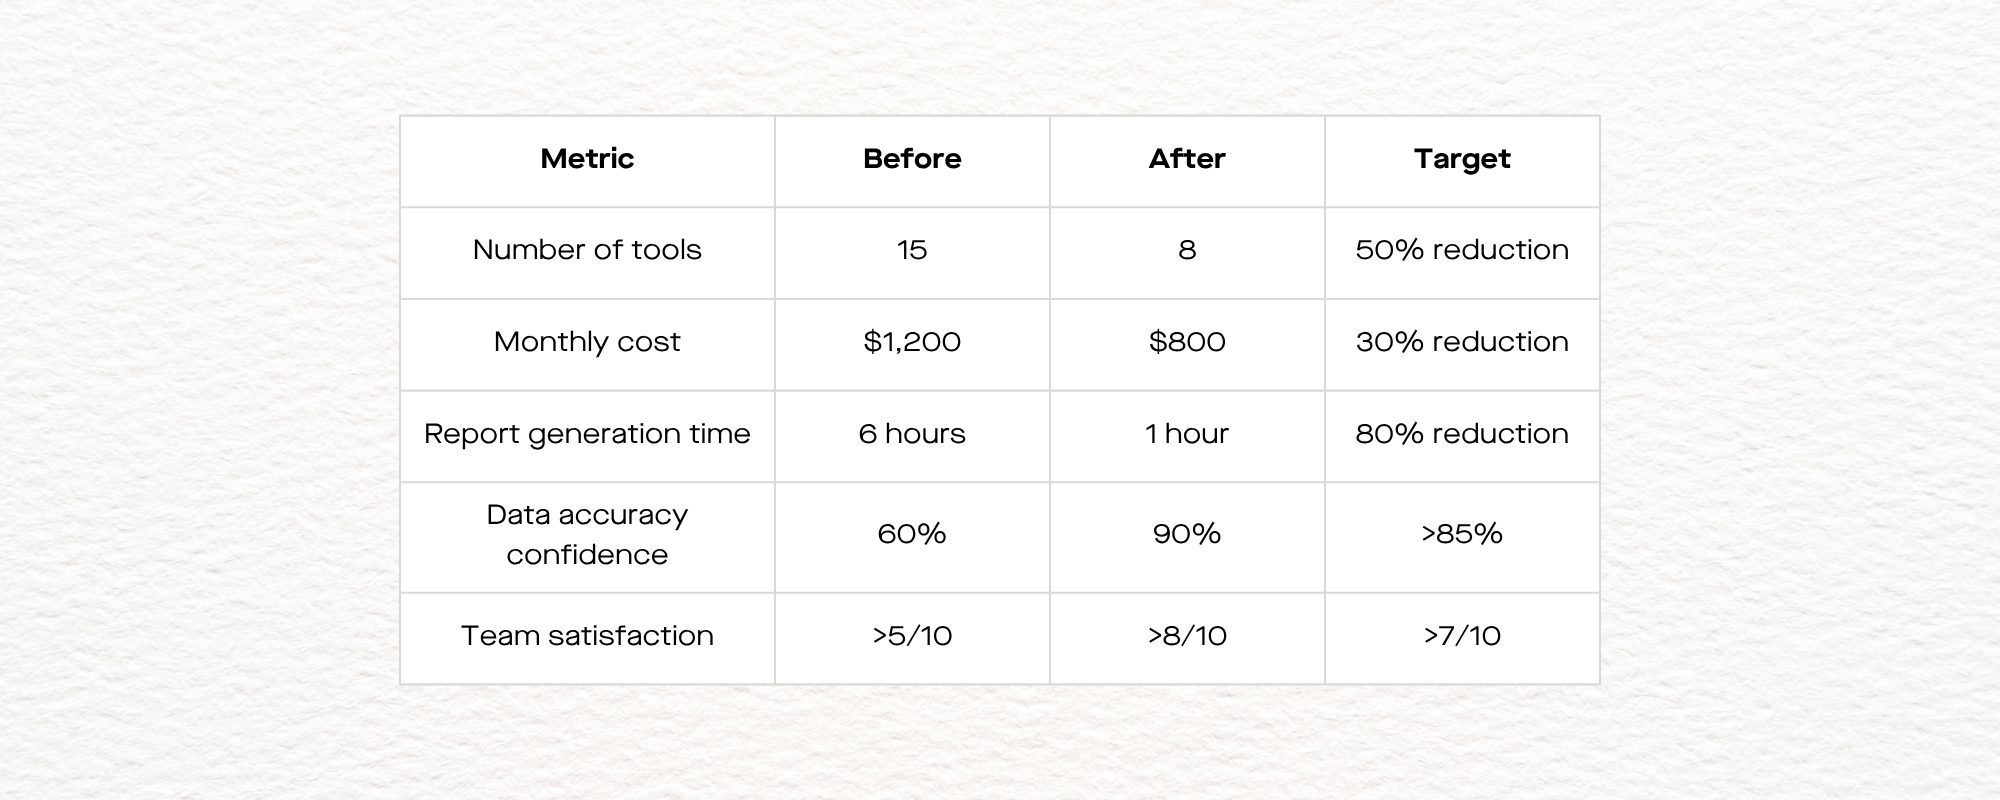
8. Success Metrics for Your Audit
9. Getting Started Today
- Hour 1: List every analytics tool your company uses
- Hour 2: Calculate total monthly cost
- Hour 3: Survey 5 team members on what they actually use
- Hour 4: Identify your top 3 overlap/waste problems
This Week: Cancel at least one unused tool
This Month: Complete Phases 1 and 2 of the audit process
Next Quarter: Implement your optimisation plan
10. Before you Go,
If the audit feels like a full-time project, that’s because it usually is.
DIGITXL runs this process for teams who don’t have the hours to untangle overlap, clean up tracking, or rebuild reporting logic themselves.
You’ll get a clear view of what to keep, cut or combine without losing momentum internally.
11. FAQ
Q. What is a digital analytics stack audit?
A. A digital analytics stack audit is a structured review of every tool that collects, processes, or reports on your digital data, plus how they connect to each other. It helps you see what to keep, cut, or combine so your reporting and decisions are based on clean, reliable data.
Q. Why should we audit our analytics tools regularly?
A. Regular audits help you find unused tools, duplicated functions, and manual reporting work that wastes time and budget. They also highlight data quality issues and integration gaps before they start affecting strategic decisions.
Q. What are the most common problems an audit uncovers?
A. Typical findings include unused “zombie” tools, poor integrations leading to manual exports, and the same metric showing different numbers across platforms. Access issues, such as ex-employees still having logins, and missing pieces like CLV tracking or real-time alerts are also common.
Q. How do I actually run a 4-week analytics stack audit?
A. Week 1 is about inventory and mapping data flows, Weeks 2 and 3 focus on scoring each tool, finding overlaps, and identifying gaps. Week 4 is where you build the keep/kill/combine plan with quick wins, medium-term fixes, and longer-term initiatives like advanced attribution.
Q. When does it make sense to bring in a specialist for the audit?
A. If listing every tool, mapping integrations, and rebuilding reporting logic would pull your team away from BAU for weeks, it’s usually time to get help. External specialists bring a tested framework, know where to look for waste, and can move faster without internal politics slowing things down.

Recent Posts


Case Studies
Business News Australia
On Track Meals
Suncorp

