1. The short version
Not every CRO metric has the same relationship with revenue.
Some metrics help you understand what customers are doing. Others are much closer to the commercial outcome. The mistake is treating all of them as equally important.
A practical CRO measurement framework looks at the relationship between:
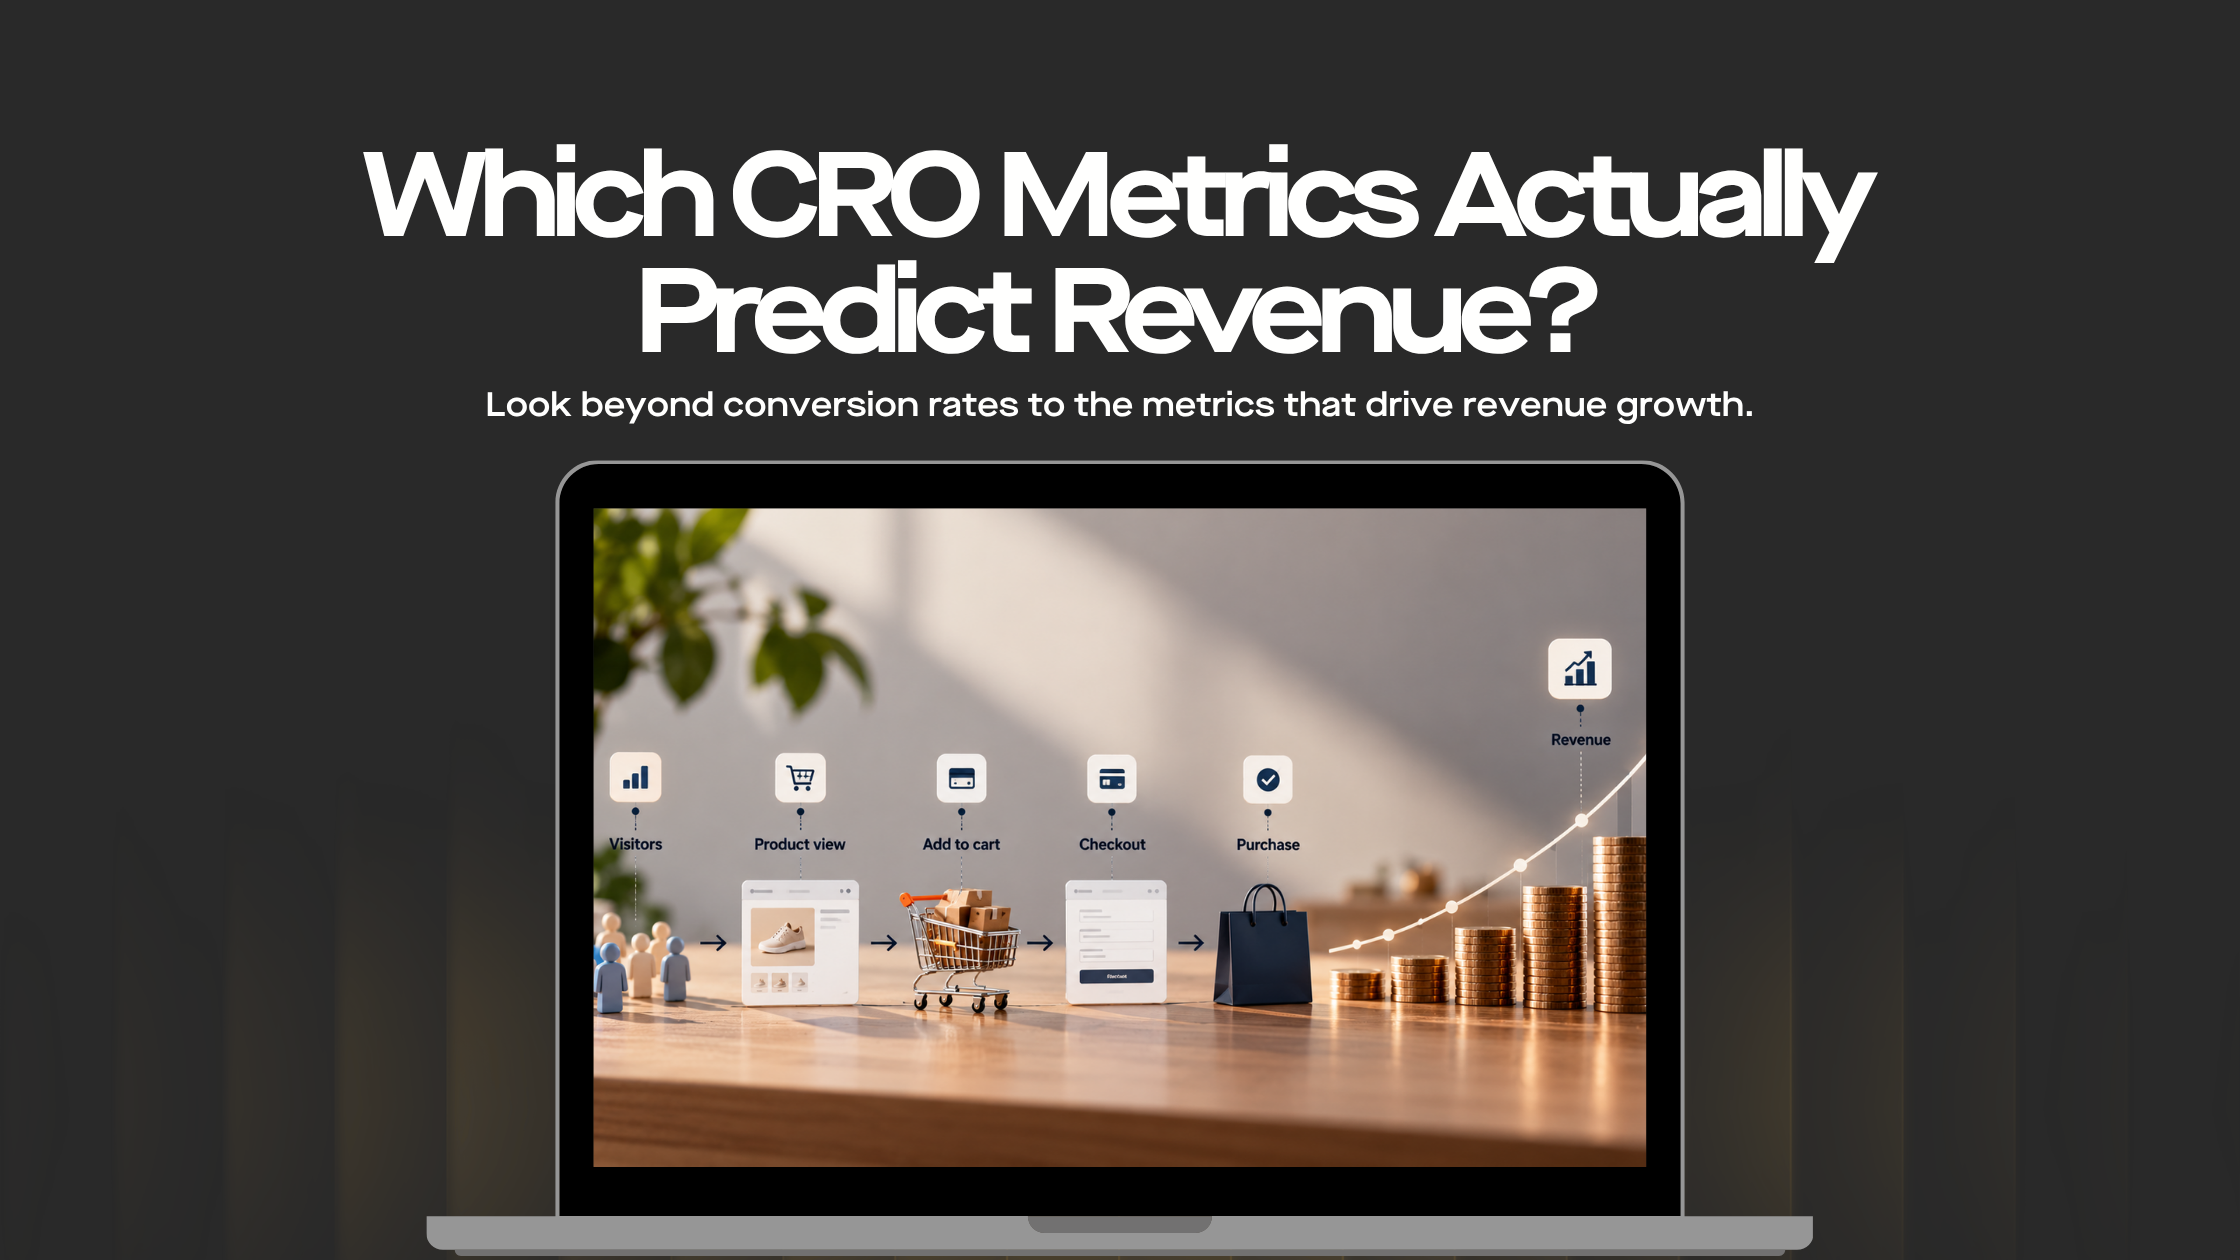
Traffic → Behaviour → Conversion → Revenue → Customer Value
For ecommerce businesses, useful performance indicators can include:
- Conversion rate
- Revenue per visitor
- Average order value
- Cart to checkout rate
- Checkout completion rate
- Product conversion rate
- Customer acquisition cost
- Repeat purchase rate
- Customer lifetime value
- Return on Investment
- Return on Ad Spend
For lead generation businesses, the relevant metrics may include:
- Form completion rate
- Marketing Qualified Leads
- Sales Qualified Leads
- Lead to opportunity rate
- Opportunity to customer rate
- Revenue per lead
- Pipeline value
- Cost per acquisition
- Customer lifetime value
These metrics should support the organisation’s business objectives and strategic objectives, rather than being selected simply because they are available in analytics or dashboard software.
The key point is simple. Conversion rate tells you how often people complete an action. It does not tell you how much commercial value those conversions create.
2. Why Conversion Rate Does Not Tell the Whole Story

Conversion rate is an important CRO metric because it shows whether a defined action is becoming more or less common.
For ecommerce, the calculation might be:
Purchases ÷ sessions
That tells you how many sessions resulted in a purchase. It does not tell you how much each customer spent or whether those customers will purchase again.
Consider a website with 100,000 sessions.
Before an optimisation:
Conversion rate: 2%
Orders: 2,000
Average order value: $100
Revenue: $200,000
After an optimisation:
Conversion rate: 2.4%
Orders: 2,400
Average order value: $80
Revenue: $192,000
The conversion rate has increased by 20%.
Revenue has decreased by 4%.
If the CRO team only reports conversion rate, the test looks successful. Once revenue and average order value are included, the picture changes.
This is why CRO measurement needs to connect customer behaviour with commercial outcomes.
A good CRO programme should not simply ask whether more people converted. It should ask whether those additional conversions created enough value to justify the change.
3. Which CRO Metrics Actually Drive Revenue?
The most useful CRO metrics are the ones that help you understand whether changes in customer behaviour are translating into commercial improvement.
Some metrics sit directly against revenue. Others are supporting indicators that help explain what is happening earlier in the conversion funnel.
The distinction matters when deciding what to optimise, what to report and how to evaluate an A/B test.
3.1 Conversion rate
Conversion rate remains one of the most important Key Performance Indicators in CRO.
It tells you whether a greater or smaller proportion of visitors are completing a defined action.
A higher conversion rate can indicate that a change has reduced friction or made the customer journey easier. However, it should be considered alongside revenue, average order value, margin and customer quality.
A conversion rate increase is more meaningful when the additional conversions also create additional commercial value.
3.2 Revenue per visitor
Revenue per visitor is one of the most useful metrics for connecting website performance with revenue.
A simplified calculation is:
Revenue ÷ visitors
It answers a commercially useful question:
How much revenue is the website generating from each visitor?
This can be particularly helpful when comparing CRO changes that affect both conversion rate and transaction value.
If conversion rate increases but revenue per visitor falls, the result deserves further investigation.
3.3 Average order value
Average order value, or AOV, measures the average amount spent per transaction.
The calculation is:
Revenue ÷ orders
AOV is particularly relevant when CRO work involves product recommendations, bundles, upselling, cross selling, free shipping thresholds or promotional offers.
A change that produces more orders but significantly reduces AOV may not deliver the revenue improvement the business expected.
3.4 Checkout completion rate
Checkout completion is much closer to revenue than many engagement metrics.
If customers are reaching checkout but not completing their purchases, the problem may involve:
- Unexpected costs
- Payment options
- Delivery information
- Account requirements
- Form complexity
- Technical issues
- Trust concerns
- Mobile usability
Improving checkout completion can have a direct effect on revenue when the additional purchases are genuine and commercially valuable.
3.5 Customer lifetime value
The first transaction does not always tell you the value of a customer.
Customer lifetime value can provide a longer term view of whether an optimisation is attracting customers who continue to purchase.
This becomes particularly important when CRO changes involve discounts, acquisition messaging, product positioning, subscription journeys or customer onboarding.
A promotion might increase the immediate conversion rate while attracting customers who rarely return. Looking at customer lifetime value gives the CRO team a better view of the outcome.
4. Leading Indicators vs Commercial Outcomes
Not every useful CRO metric is directly connected to revenue.
Some metrics act as leading indicators. They help explain what customers are doing before the commercial outcome becomes visible.
Others are closer to the result itself and can be treated as lagging indicators of performance.
The distinction is useful because CRO teams often need both.
4.1 Add to cart rate
Add to cart rate can help identify whether product pages are encouraging visitors to move beyond browsing.
Changes to product information, pricing, imagery, reviews or calls to action can influence this metric.
An increase in add to cart activity is useful evidence, but it is not enough on its own.
If customers add more products but abandon checkout, the underlying commercial problem has simply moved further down the journey.
4.2 Cart abandonment
Cart abandonment can help identify friction between product interest and purchase completion.
It can point towards issues with shipping, pricing, payment, trust or the checkout experience.
However, it should be considered alongside checkout completion and revenue rather than treated as a standalone business outcome.
4.3 Bounce rate and engagement
Bounce rate and engagement metrics can provide useful context about user behavior.
They are generally further away from revenue than completed transactions.
A lower bounce rate does not automatically mean a page will generate more revenue. Likewise, increased engagement is not necessarily positive if customers are spending more time on a page because they cannot find the information they need.
4.4 Product page engagement
Product views, image interactions, reviews and other engagement signals can help explain what customers are doing.
They become more useful when connected with downstream behaviour.
For example:
Product page interaction → Items added to cart → Checkout → Purchase → Revenue
This gives CRO teams a clearer view of where customers are progressing and where friction may be preventing the next step.
5. A Practical CRO Revenue Measurement Framework
A useful CRO measurement framework should connect customer behaviour with the commercial outcome.
One way to structure it is across five stages.
| Stage | Example metrics | What it tells you |
| Traffic | Users, sessions, traffic source | Who is arriving |
| Behaviour | Page views, engagement, items added to cart | What visitors are doing |
| Conversion | Checkout, purchases, leads | Who is taking action |
| Revenue | Revenue, revenue per visitor, AOV | Commercial outcome |
| Customer value | Repeat purchase, LTV, margin | Longer term value |
This framework separates behavioural metrics from commercial outcomes.
For example, page views and session metrics can help explain how people interact with a website, while revenue and customer lifetime value tell you more about the commercial result.
The further down the framework you move, the closer the metric generally gets to the business outcome.
That does not make the earlier metrics unimportant. They help explain why the commercial result changed.
The mistake is treating a behavioural signal as though it carries the same commercial weight as revenue.
6. How to Tell Whether a CRO Test Actually Made Money
A CRO test should not be judged only by whether its primary metric moved.
Before launching the test, define the behaviour you are trying to change and the commercial outcome you expect to influence.
For an ecommerce test, the relationship might look like:
Hypothesis → Product engagement → Items added to cart → Checkout → Purchase → Revenue
For a lead generation website:
Hypothesis → Form completion → Marketing Qualified Lead → Sales Qualified Lead → Opportunity → Customer → Revenue
This creates a clear connection between experimentation and business performance.
These are the Sales Performance Metrics Every CRO Needs to Track when the objective is to understand whether optimisation is contributing to commercial growth.
6.1 Start with the business outcome
Before choosing a test metric, understand what the business is actually trying to improve.
If the commercial objective is revenue growth, conversion rate should not become the only measure of success.
The test should have a clear connection to the outcome the business cares about.
6.2 Define the primary and supporting metrics
A test might use:
Primary metric: Conversion rate
Supporting metrics: Revenue per visitor, AOV, checkout completion and refund rate
This gives the team enough context to interpret the result properly.
For more mature experimentation programmes, guardrail metrics can also be useful. These help identify whether a positive movement in one area is being accompanied by an undesirable change elsewhere.
6.3 Watch for unintended effects
A positive movement in one metric can hide a negative movement somewhere else.
A stronger discount message might increase conversion rate while reducing AOV and margin.
A shorter lead form might increase form submissions while reducing lead quality.
A new product recommendation might increase clicks without increasing completed purchases.
The goal of CRO is not to make a metric move. It is to improve the customer journey in a way that creates meaningful commercial value.
7. Why Revenue Reconciliation Matters
This is particularly important when analytics platforms, ecommerce platforms and internal financial systems report different numbers.
You may have:
GA4 revenue
Ecommerce platform revenue
Payment provider revenue
CRM revenue
Finance or recognised revenue
These numbers may not match exactly because they measure different things and operate under different rules.
That does not automatically mean one system is wrong.
It does mean the CRO team needs to understand which number represents the business outcome being used to evaluate an experiment.
Before calling a test a commercial success, agree on the revenue source that represents the business outcome.
GA4 may report one number, the ecommerce platform another and finance a third. The differences may be legitimate, but they need to be understood before an experiment is judged.
This is where CRO analytics and measurement confidence become closely connected.
If the experiment is reported using one revenue source while the business evaluates performance using another, the results should be reconciled before drawing conclusions.
Otherwise, a CRO team can end up celebrating an improvement that does not appear in the actual commercial numbers.
8. Why Customer Quality Matters More Than Conversion Rate
A conversion is not necessarily equal to another conversion.
Two customers can complete the same transaction while having very different commercial value.
One customer might:
- Buy at full price
- Purchase again
- Have a low return rate
- Respond well to retention activity
Another might:
- Require a significant discount
- Return the product
- Never purchase again
- Have a higher servicing cost
This is why CRO teams should consider customer quality when the necessary data is available.
For mature organisations, this can mean connecting website behaviour with CRM, customer and transaction data.
The objective is to understand whether an optimisation is producing better customers, not simply more conversions.
This becomes particularly important when a CRO programme is being evaluated on revenue growth, Return on Investment or profitability rather than conversion rate alone.
9. Which CRO Metrics Should You Report to Leadership?
Senior stakeholders usually do not need every interaction recorded by the analytics platform.
They need to understand what changed, whether it mattered and what should happen next.
This is where Key Performance Indicators become useful. A KPI should have a clear relationship with the organisation’s business objectives rather than simply being another number on a performance report.
A useful CRO performance view might include:
| Metric | Why it matters |
| Conversion rate | Shows change in completion behaviour |
| Revenue per visitor | Connects traffic with commercial output |
| Average order value | Shows value per transaction |
| Revenue | Measures total commercial impact |
| Checkout completion | Identifies purchase friction |
| Cost per acquisition | Shows acquisition efficiency |
| Return on Ad Spend | Shows paid media efficiency |
| Customer lifetime value | Shows longer term customer value |
| Test uplift | Shows experiment performance |
| Test confidence | Helps assess result reliability |
These are not all equal.
Revenue may be a lagging indicator of commercial performance, while behavioural metrics can act as leading indicators that help explain why revenue is moving.
This is similar to the logic behind a Balanced Scorecard, where organisations look across multiple dimensions rather than relying on one number.
For CRO, those dimensions might include commercial outcomes, customer behaviour, acquisition efficiency, Customer Satisfaction and longer term customer value.
The exact combination will vary by business model.
The principle remains the same:
Report the metrics that help leadership make a decision.
10. What Should Your CRO Dashboard Actually Show?
A CRO dashboard should help the team understand the relationship between customer behaviour and commercial performance.
The dashboard software itself is not the important part. The value comes from choosing the right performance indicators and presenting them in a way that gives stakeholders useful performance visibility.
10.1 What changed in customer behaviour?
Show the movement in the key behavioural and conversion metrics.
For example:
Add to cart rate ↑
Checkout completion ↓
Revenue per visitor ↓
That tells a very different story from simply saying conversion rate changed.
10.2 Did the change affect revenue?
Connect the customer behaviour metrics with revenue, AOV, margin or another relevant commercial outcome.
For example:
Conversion rate ↑
AOV ↓
Revenue per visitor ↓
The test may have improved the conversion rate without improving the underlying business result.
10.3 What should we investigate next?
The dashboard should help identify the next action.
For example:
Revenue per visitor ↓
↓
Mobile checkout completion ↓
↓
Payment step abandonment ↑
↓
Investigate mobile payment experience
That gives the CRO team something practical to investigate rather than simply another number to report.
11. The Right CRO Metrics Depend on Your Business Model
There is no universal CRO metric that predicts revenue for every organisation.
For ecommerce, revenue per visitor, conversion rate, AOV, checkout completion and customer lifetime value can provide a strong commercial view.
For lead generation, the important metrics may sit further downstream.
A useful framework might be:
Visitor → Lead → Marketing Qualified Lead → Sales Qualified Lead → Opportunity → Customer → Revenue
In this situation, a higher form conversion rate may not be a success if lead quality falls.
For subscription businesses, retention and customer lifetime value may matter more than the initial conversion.
For marketplaces, transaction frequency, average transaction value and repeat behaviour may be more useful.
The right CRO metrics should reflect how the business makes money.
That is why a CRO measurement framework should be designed around the business model rather than copied from another website.
12. From CRO Metrics to Performance Management
CRO metrics become more valuable when they are part of a broader performance management process.
A monthly performance report might show that conversion rate increased. The next question should be whether that improvement contributed to the organisation’s strategic objectives.
That means connecting:
Performance data → Analysis → Decision → Action → Performance improvement
This is where CRO can move beyond website optimisation and become part of wider performance management systems.
For example, a CRO programme might identify an improvement in checkout completion. The business can then assess whether that improvement increased revenue, improved customer satisfaction and contributed to the expected Return on Investment.
Not every outcome needs to be quantitative.
Qualitative indicators such as user research feedback, customer service complaints, stakeholder satisfaction and usability findings can provide important context.
A customer may complete a purchase while still reporting that the experience was difficult. Similarly, a higher conversion rate may hide an increase in customer service enquiries.
Where relevant, measures such as Net Promoter Score, Customer Satisfaction and service delivery performance can therefore complement CRO data.
The objective is not to create more metrics. It is to create enough performance visibility to make a better decision.
13. How to Build a Better CRO Measurement Model
A practical measurement model should distinguish between what the team controls, what customers do and what the business ultimately earns.
13.1 Input indicators
Input indicators measure what the team puts into the programme.
Examples include:
- Testing activity
- Research activity
- Experiment volume
- Development effort
- User research
- Content or design changes
These measures can help with performance assessment, but more activity does not automatically mean better results.
13.2 Behavioural indicators
These measures show what users do.
Examples include:
- Page views
- Session metrics
- Items added to cart
- Form interactions
- Checkout progression
- Traffic split
- Product engagement
They are useful for diagnosing customer behaviour and identifying conversion opportunities.
13.3 Commercial indicators
These are closer to the business outcome.
Examples include:
- Revenue
- Revenue per visitor
- Average order value
- Customer lifetime value
- Cost per acquisition
- Return on Ad Spend
- Return on Investment
- Sales KPI
- Qualified pipeline
- Transaction rates
- Conversion ratios
These should be connected to the business objectives that the CRO programme is expected to influence.
14. Where DIGITXL Fits
CRO works best when experimentation, analytics and commercial measurement are connected.
At DIGITXL, we look beyond whether a test produced a higher conversion rate.
The work starts with understanding the customer journey, identifying where friction exists and determining which evidence supports an optimisation opportunity.
That can involve:
- GA4 data
- Funnel analysis
- Customer behaviour
- Heatmaps and session recordings
- User research
- Form and checkout analysis
- Ecommerce performance
- Revenue data
- CRM information
- Experiment results
The objective is to understand whether an observed change is meaningful for the business, not simply whether it produced a better looking percentage in a CRO report.
This approach also helps connect CRO with digital analytics. A change in conversion rate may be worth investigating, but the team needs reliable measurement to understand what happened after the customer converted.
It also means that CRO reporting can sit within a broader performance management approach, where the team can see how experimentation contributes to business objectives rather than reporting test results in isolation.
For businesses preparing for peak trading, this becomes even more important. A CRO programme should help identify the changes most likely to improve customer experience and commercial performance while there is still enough time to validate them properly.
CRO should ultimately answer two questions:
What should we change?
What evidence tells us that the change is worth making?
15. Final Thoughts
Conversion rate is still an important CRO metric.
It just should not be the end of the conversation.
If the goal is revenue growth, CRO teams need to understand how changes in customer behaviour flow through to transactions, revenue and longer term customer value.
That means looking at the relationship between:
Conversion Rate → Revenue per Visitor → AOV → Revenue → Customer Value
The exact metrics will vary by business, but the principle remains the same.
A useful CRO metric should help you understand what changed, why it changed and what that change means commercially.
That is the difference between measuring CRO activity and measuring CRO impact.