- Digital Analytics
- Google Analytics
Digital Analytics: The key to improving user experience
30 Nov 2023
Introduction
Digital analytics is like a helpful guide in User experience, giving useful information that helps businesses make smart choices. This blog talks about why digital analytics is so important for making websites better, looking at its parts, important numbers, ways to make things better, and the tools that help in this process. As a top digital analytics agency, we’re here to give our clients the knowledge they need to make their online journey better.
1. What is digital analytics?
It’s more than just counting visitors; it’s about understanding how to improve UX with digital analytics. By leveraging tools to track user behaviour, preferences, and interactions, businesses can gain a complete picture of how users engage with their platforms.
2. The Key Components of Digital Analytics:
2.1 Data Collection
Digital analytics starts with the collection of data from diverse sources such as websites, mobile apps, social media, and other online platforms. This data may include user demographics, device information, browsing behavior, and more.
2.2 Data Processing
Once collected, raw data needs processing to extract meaningful insights. This involves organising, cleaning, and transforming data into a format that is conducive to analysis. Proper data processing ensures accuracy in subsequent interpretations.
2.3 Data Analysis
Analysis is at the core of how Digital Analytics helps improve user experience. Businesses use statistical methods to uncover trends and patterns that highlight user preferences and behaviours.
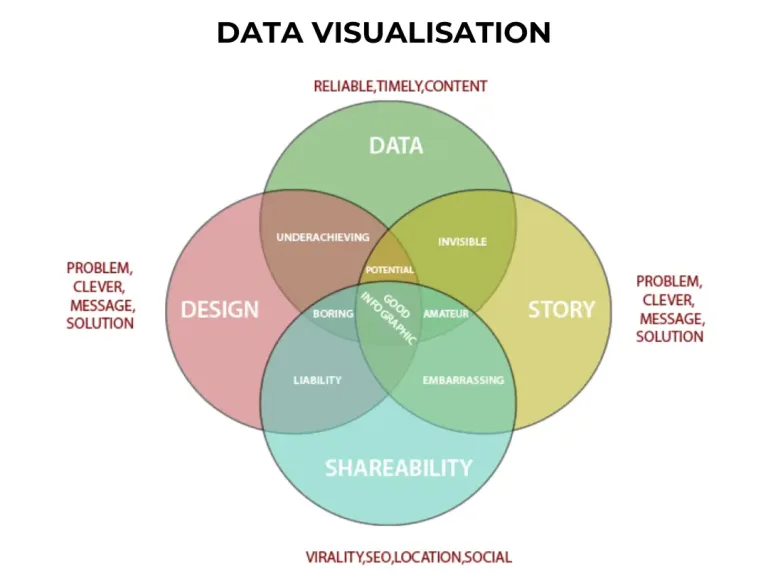
2.4 Data Visualisation
To make the insights more accessible and understandable, data is often presented through visualisations such as graphs, charts, and dashboards. Clear Data visualisations help stakeholders grasp complex information at a glance.
2.5 Event Tracking
Event tracking involves monitoring specific interactions or actions on your website, such as clicks on buttons, form submissions, or video views. This granular data provides insights into user engagement with specific elements, helping you refine your website’s functionality. Our GA4 and Adobe consultants excel in event tracking providing in-depth insights into user behavior to enhance your overall digital strategy
2.6 User Segmentation
Segmenting users based on demographics, behavior, or other criteria allows for a more detailed analysis of distinct user groups. This segmentation can unveil patterns and preferences among different audience segments, aiding in targeted optimisations.
2.7 Custom Dimensions and Metrics
Digital analytics tools often allow the creation of custom dimensions and metrics tailored to your specific business goals. This flexibility enables a more nuanced analysis, focusing on the metrics that matter most to your unique objectives.
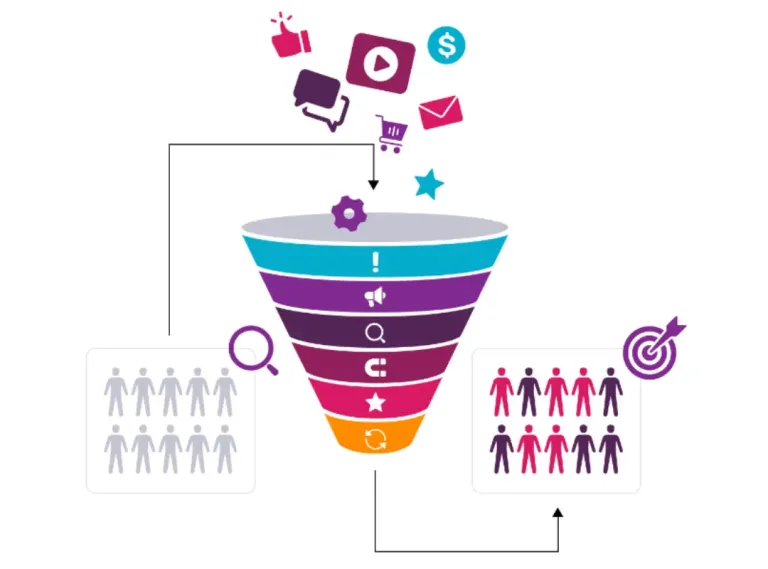
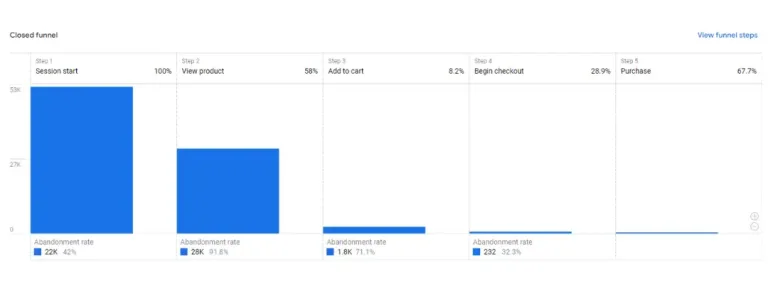
2.8 Funnel Analysis
Funnels represent the step-by-step journey users take on your website, from initial interaction to conversion. Analysing funnel performance helps identify drop-off points and areas for improvement in the conversion process.
2.9 Predictive Analytics
Predictive analytics utilises historical data to forecast future trends and user behavior. By identifying patterns and predicting potential outcomes, businesses can proactively adjust strategies to meet evolving user expectations. By integrating predictive analytics into your analytics strategy, our consultants can help you proactively shape and refine your digital initiatives based on anticipated user trends and behaviors, ensuring a forward-thinking approach to optimize user experiences.
3. Key Metrics to Monitor
3.1 Key Metrics to Monitor
Understanding where your website traffic comes from (e.g., search engines, social media, referrals) helps in tailoring strategies to target high-performing channels.
3.2 User Engagement
Metrics like page views, time spent on site, and bounce rate indicate how users interact with your content. Higher engagement generally correlates with a positive user experience.
3.3 Conversion Rates
Tracking conversions, whether they are sales, sign-ups, or other desired actions, provides insights into the effectiveness of your website in achieving business goals.
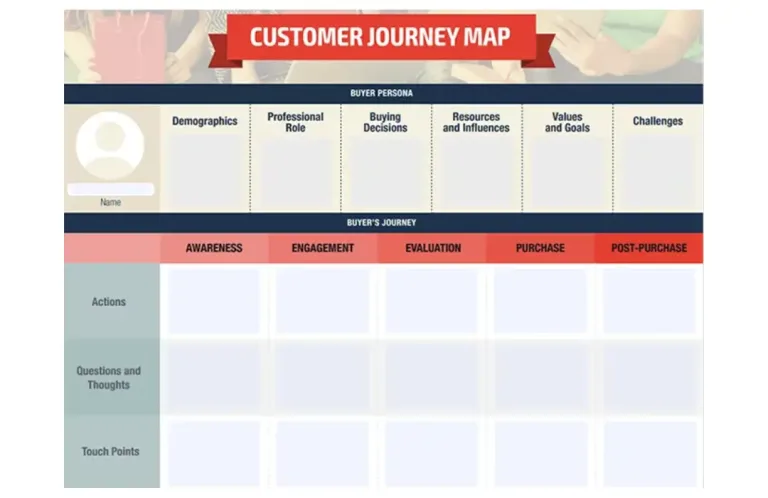
3.4 User Journey
Analysing the user’s journey through your website helps identify pain points and areas for improvement. This includes examining the flow from landing pages to conversion or exit points.
3.5 Device and Browser Compatibility
With the increasing diversity of devices and browsers, ensuring a seamless experience across various platforms is crucial. Analytics can reveal potential issues on specific devices or browsers.
3.6 Customer Lifetime Value (CLV)
CLV measures the total value a customer brings to your business over their entire relationship with your brand. Monitoring CLV helps in understanding the long-term impact of your user experience and marketing efforts.
3.7 Exit Pages
Identifying the pages where users commonly exit your website can pinpoint potential issues. High exit rates on certain pages may indicate a need for improvement in content, usability, or calls to action.
3.8 Error Rates
Monitoring error rates, such as 404 page not found errors, provides insights into user frustration and potential technical issues. Addressing these errors promptly enhances user experience and ensures smooth navigation.
3.9 Social Media Engagement
Integrating social media metrics into your analytics strategy helps gauge the impact of social platforms on user behavior. This includes tracking social shares, comments, and click-through rates from social media to your website.
3.10 Feedback and Surveys
Implementing feedback tools and surveys within your website allows direct input from users. Analysing this qualitative data provides a deeper understanding of user sentiment and areas for improvement.
4. How to Optimise User Experience Using Digital Analytics
4.1 Identify Pain Points
Digital analytics enables businesses to identify areas of friction in the user journey. High bounce rates or drop-offs at specific pages indicate potential issues that need attention.
4.2 Personalisation
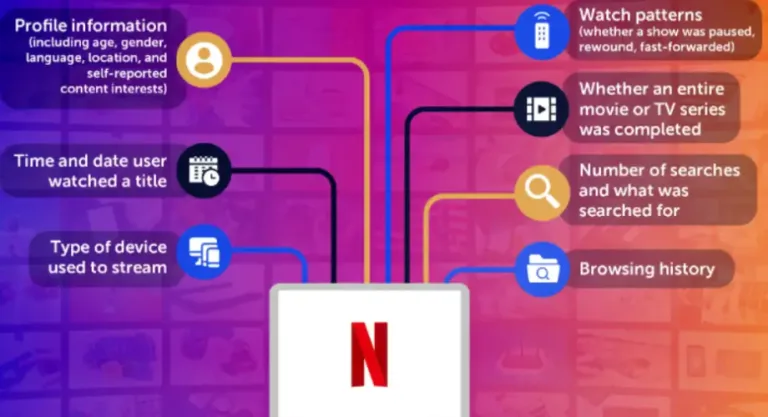
Using data to create personalised experiences—tailored recommendations and promotions—is one of the most effective digital analytics tips for improving user experience. For example, Netflix leverages behavioural analytics to provide customised content suggestions, enhancing overall engagement.
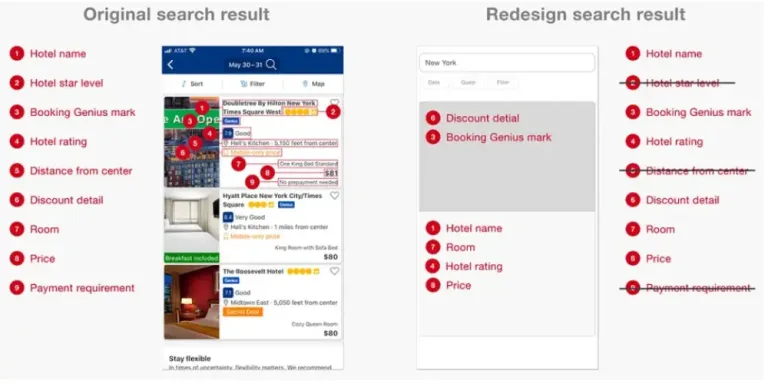
4.3 A/B Testing

4.4 Responsive Design
Insights into the devices and browsers used by your audience guide the development of a responsive design. Ensuring your website is accessible and visually appealing across various platforms enhances the overall user experience.
4.5 Content Optimisation
Analyse content performance to understand what resonates with your audience. Adjust your content strategy based on which pages garner the most engagement, and continually refine to meet user expectations.
4.6 Usability Testing
4.7 Speed and Performance Optimisation
Analysing page load times and performance metrics is crucial. Slow-loading pages can lead to high bounce rates. Digital analytics helps in identifying performance bottlenecks and optimising for a faster, more seamless user experience.
4.8 Personalised Recommendations
Utilise data on user preferences and behavior to implement personalised recommendations. Whether it’s product suggestions, content recommendations, or tailored promotions, personalsation enhances user engagement.
4.9 User Surveys and Feedback Analysis
Leverage user surveys and feedback collected through analytics tools to gain insights into user satisfaction and pain points. Analysing this information can guide strategic improvements aligned with user expectations.
4.10 Accessibility Audits
Ensure that your website is accessible to users with disabilities. Digital analytics can identify areas that may pose challenges for users with different abilities, prompting necessary adjustments for a more inclusive user experience.
5. Digital Analytics Tools

5.1 Google Analytics
Widely used for its robust features, Google Analytics provides a comprehensive view of website performance, user behavior, and traffic sources.
5.2 Adobe Analytics
Offering advanced analytics and segmentation capabilities, Adobe Analytics is suitable for businesses requiring in-depth insights into customer behavior.
5.3 Hotjar
Hotjar combines analytics and user feedback tools, allowing businesses to visualise how users interact with their site and gather feedback through surveys and heatmaps.
5.4 Crazy Egg
Known for its heatmaps, scrollmaps, and user recordings, Crazy Egg helps businesses understand where users click, how far they scroll, and what elements capture their attention.
5.5 Optimizely
A powerful experimentation platform, Optimizely enables A/B testing and personalisation to optimise the user experience and drive conversions.
5.6 Mixpanel
Mixpanel focuses on event-based tracking and segmentation, providing detailed insights into user interactions. It is particularly effective for businesses seeking in-depth event analysis.
5.7 Heap Analytics
Heap Analytics allows retroactive event tracking, meaning you can define events after data collection. This flexibility is valuable for businesses that want to explore new metrics without losing historical data
5.8 Kissmetrics
Kissmetrics specialises in customer-centric analytics, emphasising user behavior and segmentation. It helps businesses understand the customer journey and optimise experiences for maximum engagement.
5.9 Piwik PRO
Piwik PRO is an open-source web analytics platform with a strong emphasis on data privacy and security. It offers a self-hosted solution for businesses with strict data protection requirements.
5.10 Clicktale
Clicktale provides heatmaps, session recordings, and conversion analytics. This tool is valuable for visualising how users interact with your website and understanding their behavior on a granular level.
6. FAQ
Q. What is digital analytics and how does it improve user experience?
A. Digital analytics involves collecting and analysing data from websites, apps, and digital channels to understand user behaviour. By identifying friction points, personalising experiences, and testing improvements, businesses can create smoother, more engaging user journeys.
Q. Which metrics are most important for tracking user experience?
A. Key metrics include user engagement (time on site, bounce rate), conversion rates, device/browser performance, customer lifetime value (CLV), exit pages, and error rates. Monitoring these helps uncover pain points and areas for optimisation.
Q. How can A/B testing and usability testing enhance UX?
A. A/B testing allows businesses to compare different versions of a page or element to see what works best. Usability testing involves real users navigating the site to identify issues. Together, these methods provide data-driven insights for continuous improvements in UX.
Q. What tools are most effective for digital analytics?
A. Popular tools include Google Analytics and Adobe Analytics for deep performance tracking, Hotjar and Crazy Egg for heatmaps and user feedback, and Optimizely for A/B testing. Platforms like Mixpanel and Heap Analytics provide advanced event-based tracking and segmentation.
Q. Can digital analytics help with personalisation?
A. Yes. By segmenting users and analysing their behaviour, businesses can deliver personalised recommendations, targeted promotions, and tailored content. Personalisation increases engagement and conversions, leading to stronger long-term customer relationships.
Q. How can a CRO agency help improve user experience?
A. A CRO (Conversion Rate Optimisation) agency specialises in enhancing website or app performance by analysing user behaviour and identifying opportunities to increase conversions. They use data-driven strategies, such as A/B testing, heatmaps, and user feedback, to optimise user journeys. By improving the flow, design, and functionality of digital experiences, a CRO agency can significantly boost both user satisfaction and conversion rates.

Recent Posts


Case Studies
Business News Australia
On Track Meals
Suncorp

