- Digital Analytics
The Shopify & GA4 Data Discrepancy: Expert Insights for Marketing & Analytics Pros
14 May 2025
As an analytics consultant at Digitxl, working inside a specialist analytics agency, I’ve sat across the table from countless digital, marketing, e-commerce, and analytics teams. One question surfaces with striking regularity: “Why don’t our Shopify numbers perfectly match what we’re seeing in Google Analytics 4?” If this sounds familiar, you’re not alone. It’s one of the most common – and often frustrating – challenges in the e-commerce analytics landscape.
The quest for a single, perfectly unified source of truth is understandable. Your teams rely on accurate data to drive strategy, measure campaign effectiveness, and report on ROI. When key metrics like revenue, orders, or conversion rates show discrepancies between your e-commerce platform (Shopify) and your web analytics tool (GA4), it can sow seeds of doubt and make confident decision-making difficult.
But here’s the crucial insight we bring to our clients: 100% parity between these platforms is, more often than not, an unrealistic expectation. This isn’t necessarily a sign that something is broken. Instead, it’s a reflection of fundamental differences in how these powerful tools collect, process, and attribute data.
This post aims to pull back the curtain from an agency perspective. We’ll explore why these discrepancies occur, share a real-world scenario from our case files, and provide actionable strategies your teams can use to navigate these differences and ultimately leverage both platforms for what they do best.
1.1 The Usual Suspects: Core Reasons for Data Divergence We See Daily
In our experience working with diverse e-commerce clients, several core factors consistently contribute to the data variances between Shopify and GA4:
- Defining the Fundamentals (Page Reloads, Unique Visitors, Sessions): It starts with the very basics. How Shopify and GA4 define a “page reload,” a “unique visitor,” or a “session” can differ. For instance, GA4 might meticulously count every page reload, whereas a browser interacting with Shopify might not re-log a reload of an already cached page. Session definitions, including inactivity timeouts or how bot traffic is handled, also vary, leading to different counts.

- The Tracking Tango (JavaScript, Cookies vs. Server-Side): GA4 primarily operates on client-side tracking – it uses JavaScript code and cookies that run in your customer’s browser. If a user has JavaScript disabled, uses aggressive cookie blockers, or employs privacy-centric browsers, GA4’s ability to track can be hampered. Shopify, conversely, records transactional data directly on its servers when an order is processed. This server-side capture makes its core sales data less vulnerable to these client-side interruptions.
- The Privacy Imperative (Cookie Consent & Ad Blockers): With GDPR, CCPA, and other privacy regulations, cookie consent banners are now ubiquitous.
 If a user opts out of tracking cookies, GA4 receives limited or no data for that individual. Similarly, ad blockers and browser privacy extensions are designed to prevent scripts like GA4’s from loading or transmitting data. While Shopify will still capture the sale if it happens, GA4’s view of the customer journey leading to that sale can become fragmented.
 - The Simple Slip-Up (Time Zone Misalignment): It sounds basic, but we often find that differing time zone configurations in Shopify and GA4 are a culprit. If one platform is reporting in PST and the other in EST, your daily, weekly, and monthly figures will never align. It’s a quick check, but a critical one.
- The “Secret Sauce” (Proprietary Algorithms): Both Shopify and Google employ their own complex, proprietary algorithms for data processing and reporting. The precise inner workings of these algorithms aren’t public knowledge. This means there will always be inherent differences in calculation methodologies that can lead to slightly different outputs.
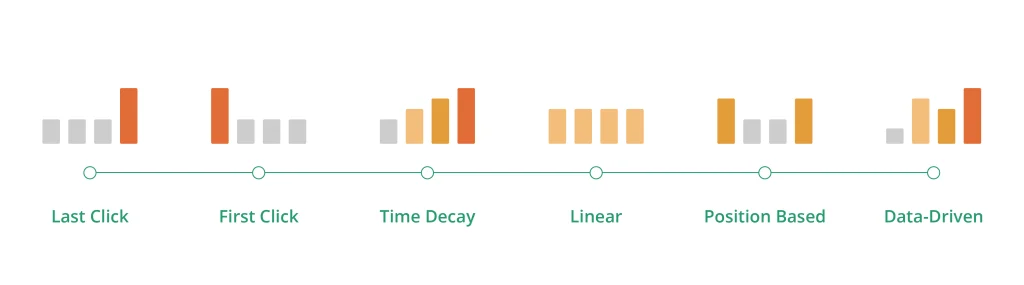
- The Credit Game (Attribution Modelling): How credit for a sale is assigned is a major point of divergence. Shopify’s internal reports often default to a straightforward last-click attribution. GA4, especially with its data-driven attribution model, is designed to distribute conversion credit across multiple touchpoints in the customer journey. This difference alone can significantly alter how channel performance and conversion data appear between the two platforms.
 If a user opts out of tracking cookies, GA4 receives limited or no data for that individual. Similarly, ad blockers and browser privacy extensions are designed to prevent scripts like GA4’s from loading or transmitting data. While Shopify will still capture the sale if it happens, GA4’s view of the customer journey leading to that sale can become fragmented.
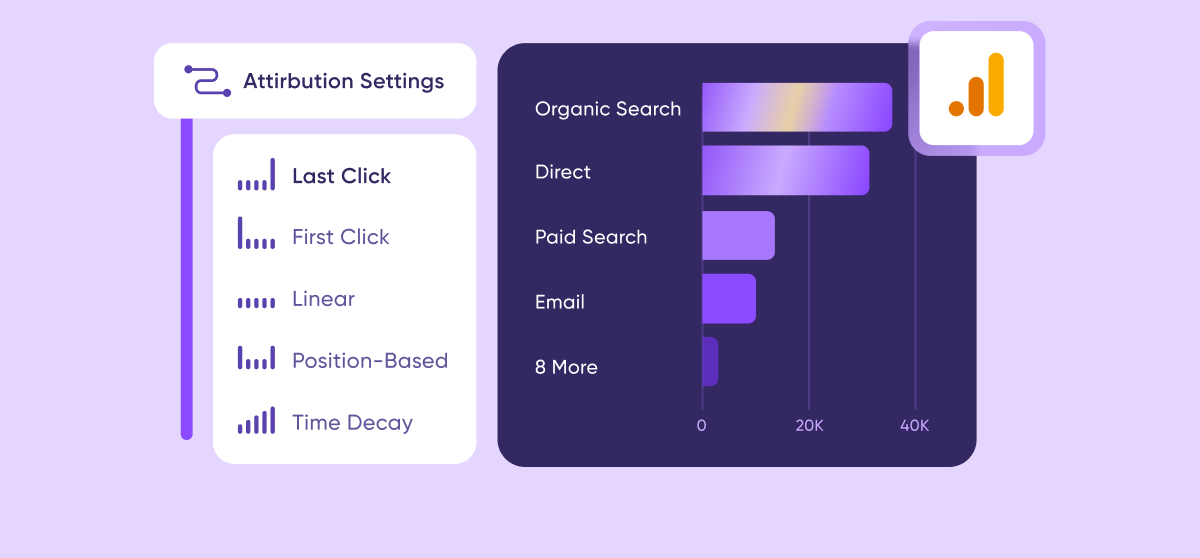
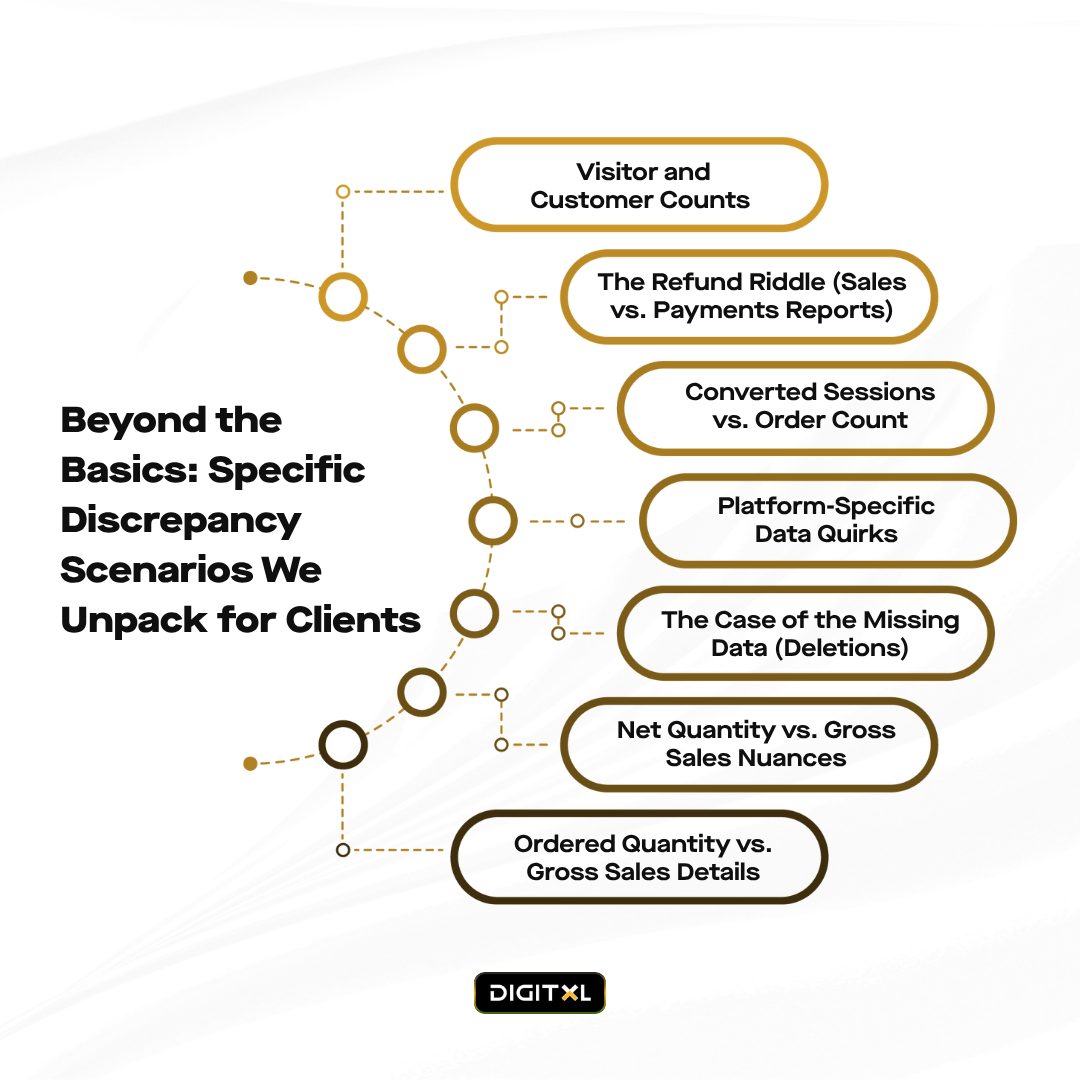
2. Beyond the Basics: Specific Discrepancy Scenarios We Unpack for Clients
Drawing from Shopify’s own documentation and our hands-on experience, here are some specific areas where your teams might notice discrepancies:
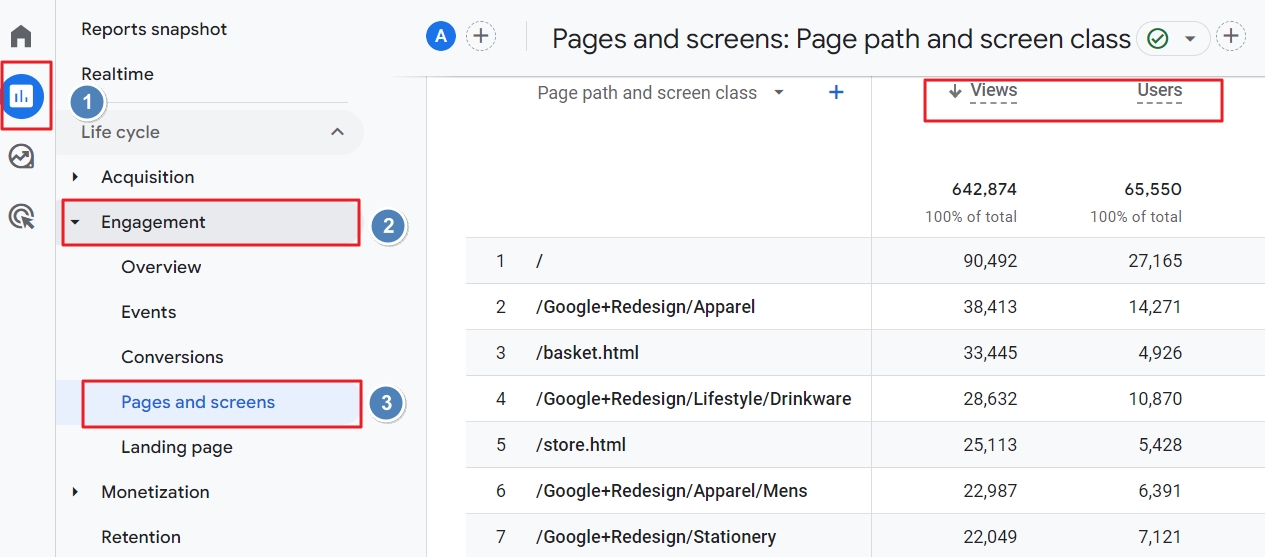
- Visitor and Customer Counts: Shopify reports often display ‘Visitors’ or ‘Customers’ as unique individuals over a period. For example, a customer visiting on Monday and again on Wednesday is one unique customer for the week, not two. If your team simply sums daily unique visitor counts, it won’t match the period’s total unique visitor count reported by Shopify. This is by design, reflecting true unique individuals.
- The Refund Riddle (Sales vs. Payments Reports): This is a frequent source of confusion. Shopify’s Sales reports and its Payments finance reports handle refunds and returns differently. The Sales report might indicate a return, while the Payments report details the actual monetary refund. As Shopify clarifies, “Sales reports include your returns and the Payments finance report includes refunds.” To get an accurate view of refunded amounts, your analytics agency might need to customize reports, for instance, by adding the Payment status column to the Sales over time report and filtering appropriately..
- Converted Sessions vs. Order Count: It’s not uncommon to see fewer “sessions converted” in Shopify (or GA4) than the total number of orders. This often occurs when a customer makes multiple distinct purchases within a single browsing session. Imagine a customer buys an item, continues browsing, and then makes another separate purchase minutes later without leaving your site. This results in multiple orders but might be recorded as only one “converted session.”
- Platform-Specific Data Quirks: Occasionally, temporary, platform-specific reporting anomalies can affect data. Shopify has noted a past example concerning Shop Pay conversion rate accuracy during a specific period. While such issues are typically resolved, it underscores that historical data can sometimes be impacted by these nuances.
- The Case of the Missing Data (Deletions): If an order, customer, product, or variant is deleted from your Shopify admin, its associated data is subsequently removed from Shopify’s reports. This can create discrepancies when comparing to historical data or if GA4 captured an event related to an entity that no longer exists in Shopify.
- Net Quantity vs. Gross Sales Nuances: Gross sales are generally product price × quantity (including canceled/unpaid orders). Net quantity is number of items sold – number of items returned. These are calculated using different logic and won’t always align intuitively without understanding their precise definitions.
- Ordered Quantity vs. Gross Sales Details: In Shopify reports, “Ordered quantity” typically reflects only products specifically ordered by the customer initially. It might not include items added to an order via an edit after placement. Gross sales, however, would encompass the total recorded value for all products, including those edited into the order.
3. From Our Agency Case Files – Unravelling the Numbers
To illustrate how these factors play out in the real world, let’s look at a typical scenario we encountered (client details anonymised, of course).
Client Profile: a successful online marketplace for Ready-to-eat meals, powered by Shopify. They actively invest in Google Ads and social media marketing, relying on our agency to guide their analytics and performance optimisation.
The Challenge: The leadership team approached us, concerned about significant discrepancies they’d observed for the previous month:
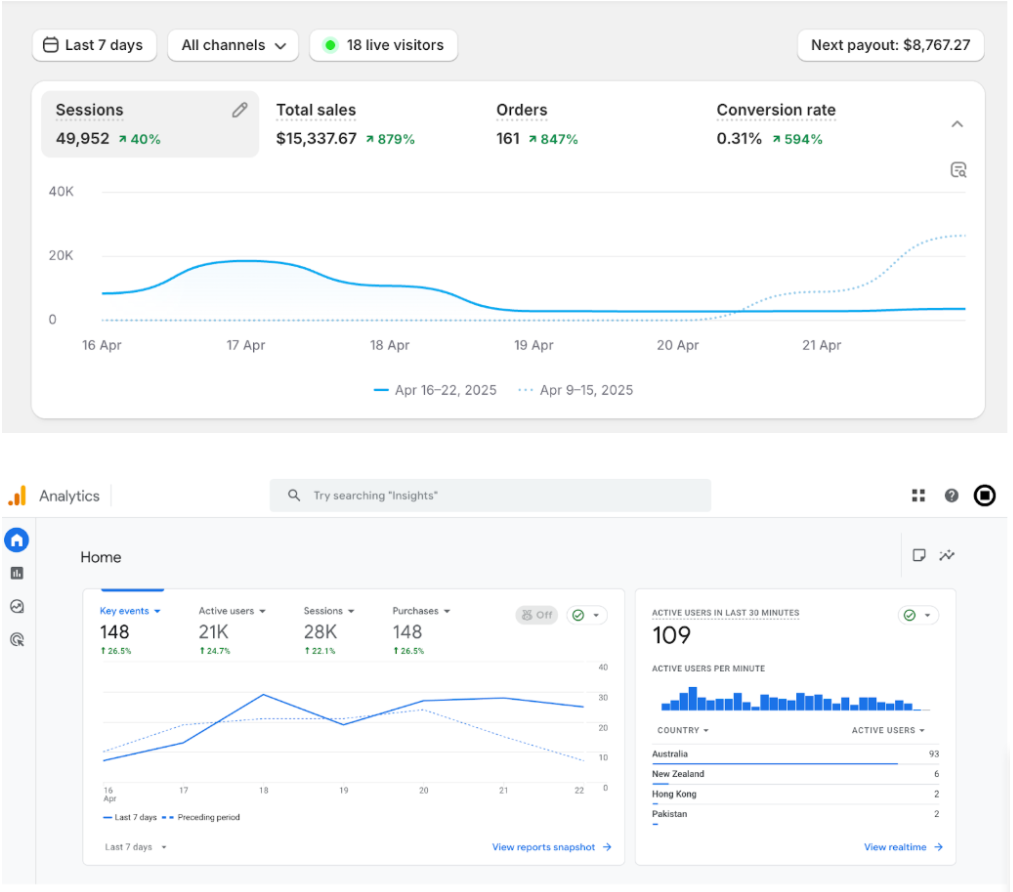
- Shopify Admin Data: 1,200 orders, $72,000 gross revenue.
- Google Analytics 4 Data: 980 purchase events (transactions), $58,500 revenue.
- Conversion Rate Variance: Shopify’s “Online store conversion rate” stood at 2.5%, while GA4’s e-commerce conversion rate (session-based) was 1.9%.
- The Core Concern: The marketing team was worried their campaigns (tracked via UTMs in GA4) were underperforming, and the leadership team questioned the overall data integrity. The ~$13,500 revenue gap was a major point of anxiety.
3.1 Our Agency's Diagnostic and Resolution Process:
We initiated a systematic investigation:
Foundation First (The Quick Wins):
- Time Zones: Verified that both Shopify and GA4 were aligned to AEST. (All good here).
- GA4 Tagging: Confirmed correct GA4 tag implementation across all pages via Shopify’s native integration, with e-commerce tracking properly enabled. (Correctly set up).
- GA4 Filters: Reviewed GA4 filters to ensure no significant internal IP exclusions or other segment filters were skewing the data. (Standard filters, not explaining the full discrepancy.)
Deeper Dive – Unpacking Platform Nuances:
- Cookie Consent Impact: The client has a strong customer base in Australia and New Zealand. We analysed GA4’s consent mode signals and observed that a notable percentage of users from these regions were either declining tracking cookies or had browser settings that limited GA4’s visibility. Shopify, however, still captures these sales server-side upon completion. This accounted for a significant portion of the transaction and revenue difference.
- Ad Blocker Prevalence: We educated the client on the general impact of ad blockers (often affecting 10-30% of users, depending on demographics), which prevent GA4 from firing, leading to undercounted sessions, users, and conversions in GA4.
- Attribution Model Differences: Shopify’s internal “sessions converted” often uses a last-touch model.GA4 was utilising its default data-driven attribution. We explained how GA4 distributes conversion credit across multiple touchpoints. If a user initiated via an ad (seen by GA4), left, and later returned directly to purchase, Shopify would log the sale. GA4 should still attribute this if the tracking persisted, but any break (cleared cookies, device switch) could cause GA4 to miss the full connection.
- Order Editing & Manual Orders: The client occasionally modified orders post-purchase or created custom orders directly within Shopify. While Shopify’s revenue correctly reflected the final amount, these modifications weren’t always perfectly mirrored as e-commerce events pushed to GA4, which typically tracks the initial online transaction.
- Gross vs. Net Revenue Reporting: We clarified that Shopify’s $72,000 was gross revenue. GA4’s reported revenue usually reflects the transaction value at the point of the purchase event. Returns processed later wouldn’t adjust GA4 revenue downwards unless a specific refund data import process was in place. This explained a part of the revenue gap when comparing Shopify’s gross to GA4’s initially reported transaction revenue.
- Multiple Orders, Single Session: A closer look revealed instances where customers placed multiple small, distinct orders within a short timeframe (a single session). Shopify correctly logged these as separate orders. GA4, depending on its sessionization and conversion event definition (e.g., one purchase event per session), sometimes recorded a lower transaction count than Shopify’s order count.
3.2 Our Recommendations & The Path to Clarity:
- Empowerment Through Education: Our first step was comprehensive client education. We provided a detailed report explaining why 100% parity is unrealistic, outlining the contributing factors.
- Defining “Sources of Truth” for Different Needs:
- For Financial Reporting: Shopify was designated the “source of financial truth” for gross/net revenue, order counts, and COGS – the numbers directly reconciling with their bank statements.
- For Behavioural & Marketing Insights: GA4 was positioned as the primary tool for understanding on-site user behaviour, acquisition channel performance (focusing on trends and comparisons), audience segmentation, and mapping the customer journey leading up to a potential purchase.
- Focus on Trends, Not Just Absolute Numbers: We advised the client to monitor directional trends in GA4 (e.g., “Is our conversion rate from organic search improving month-over-month?”) rather than getting bogged down by exact numerical matches with Shopify. If both platforms indicate a downward sales trend, that’s a clear action signal, even if the absolute figures differ.
- Strategic GA4 Enhancements (Roadmap Items):
- Server-Side Tagging: To improve GA4 data accuracy by mitigating client-side blocking, we proposed exploring server-side GTM and GA4 event sending as a future initiative.
- Refund Data Import to GA4: We recommended implementing a process to import refund data into GA4 to achieve a more accurate net revenue picture within the GA4 interface.
- Consistent Shopify Order ID in GA4: Ensuring the Shopify Order ID is consistently passed to GA4 as a custom parameter with each purchase event allows for easier (though not always perfect) order-level reconciliation.
- Refined Agency Reporting: We adjusted our reporting dashboards to clearly distinguish Shopify financial data from GA4 behavioural/marketing data, incorporating annotations to explain common reasons for variances proactively.
By implementing these strategies, we helped the client build confidence in their data by understanding its context. Their teams learned to leverage Shopify for definitive sales figures and GA4 for its rich behavioural and marketing insights, accepting and navigating the inherent differences.
4. Actionable Strategies for Your Internal Teams (Digital, Marketing, E-commerce, Analytics)
As your google analytics agency, we recommend the following strategies for your teams:
- Foster Cross-Team Understanding (Proactive Education): Don’t let discrepancies become a point of contention. Ensure all relevant teams (marketing, e-commerce, analytics, digital strategy) understand why these differences occur. Share resources like this post internally.
- Set Realistic Data Expectations: Communicate clearly from the outset that 100% data parity between Shopify and GA4 is highly improbable. This manages expectations and prevents unnecessary alarm.
- Collaboratively Define Primary Data Sources: Work together to establish which platform will be the designated “source of truth” for specific types of data. For example:
E-commerce/Finance Teams: Shopify is typically the go-to for final financial revenue, order counts, and inventory.
Marketing/Digital Teams: GA4 is invaluable for analysing user behaviour, campaign performance, content engagement, and audience segmentation.
Analytics Teams: Your role is to bridge these sources, understand the nuances, and provide consolidated insights.
- Prioritise Trends and Insights Over Absolute Matches: Emphasise that while absolute numbers might differ, the directional trends (growth, decline, shifts in channel contributions) should generally align. Significant divergence in trends warrants deeper investigation.
- Invest in Regular Audits & Data Governance: Your analytics team should periodically review the GA4 tracking setup, filter configurations, consent mode implementation, and Shopify integration to ensure data collection is as robust and accurate as possible within each platform’s constraints.
- Demand Transparent and Contextualised Reporting: Whether it’s internal reporting or reports from agency partners like us, ensure data sources are clearly labelled. If data from both platforms is presented, include brief explanations or an appendix detailing common reasons for potential variances.
5. Conclusion: Partnering for Clarity and Actionable Insights
In the dynamic world of e-commerce analytics, precision is key, but so is understanding context. Discrepancies between Shopify and GA4 are not typically a sign of a “broken” system but a reflection of their distinct methodologies, intended purposes, and the technological realities of web tracking.
As an analytics agency, our role is to help you navigate these complexities.. We provide the expertise to not only explain the “why” behind data differences but also to help your teams harness the unique strengths of each tool. By fostering understanding, implementing robust tracking and reporting strategies, and focusing on actionable insights, we can empower your e-commerce business to make data-informed decisions with greater confidence, even when the numbers don’t perfectly mirror each other. The ultimate goal isn’t to force an impossible reconciliation but to extract the most valuable, actionable intelligence from all your available data sources.
If your teams are grappling with these challenges, we’re here to help provide clarity and strategic guidance.