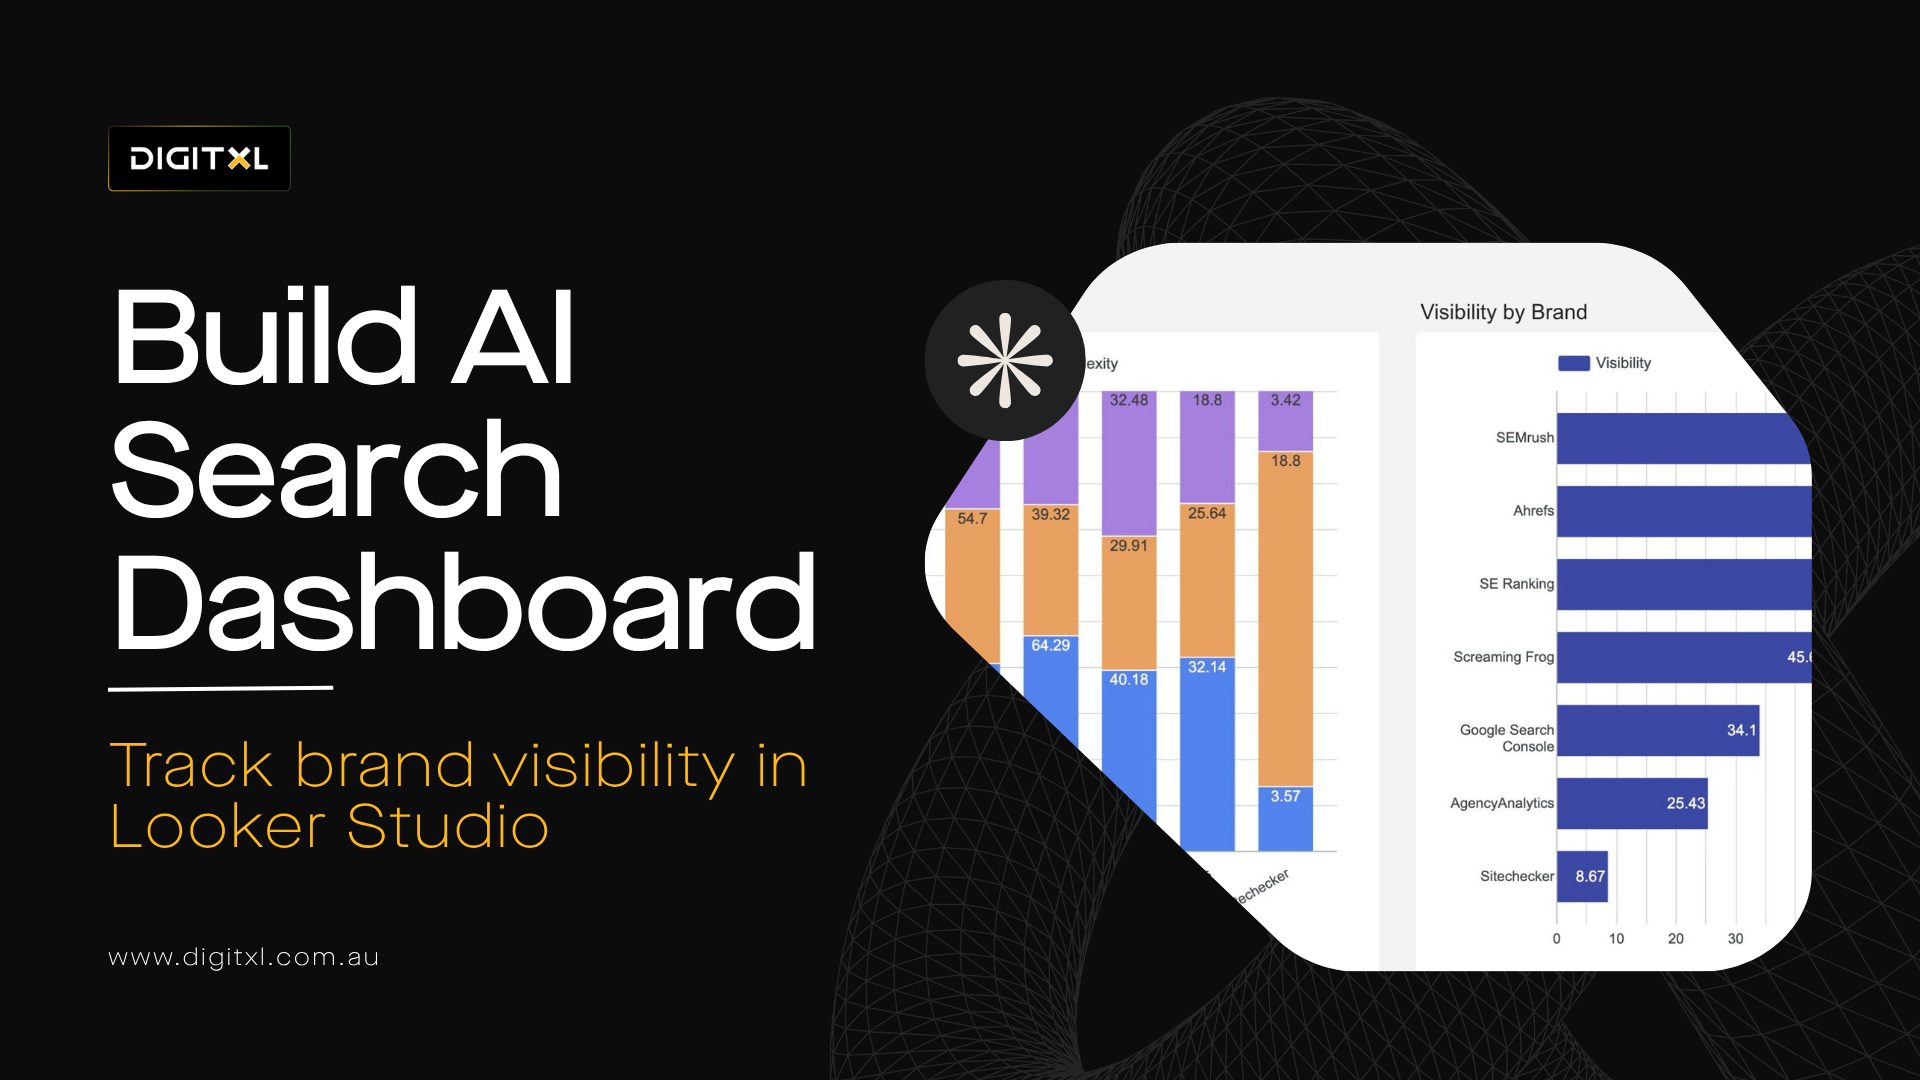
1. How Do You Build an AI Search Visibility Dashboard in Data Studio?
To build an AI search visibility dashboard in Data Studio, connect Google Search Console, GA4, Bing Webmaster Tools data and a manual AI prompt tracker. The dashboard should track AI Overview presence, brand mentions, website citations, competitor visibility, AI referral traffic, landing page engagement and conversions.
This gives your SEO, analytics and marketing teams one place to see how AI search is affecting discovery, traffic and business outcomes.
2. What Is an AI Search Visibility Dashboard?
An AI search visibility dashboard shows how your brand appears across AI-led search experiences and what happens when users reach your website.
It should help answer questions such as:
- Are we appearing in Google AI Overviews?
- Are our pages being cited as sources?
- Are competitors appearing more often than us?
- Are AI platforms sending traffic?
- Are those visitors engaging or converting?
- Which pages need stronger content?
Data Studio is a practical place to build this because it can visualise Google Search Console and GA4 data in one reporting environment. Google also documents native Data Studio connectors for Google Analytics and Search Console, which makes it a useful starting point for SEO and analytics reporting.
3. Why AI Search Visibility Needs Its Own View
AI search can influence visibility without creating a normal click path.
For example, a user may read an AI Overview, notice your brand as a cited source, and return later through branded search. Another user may see a competitor cited and never reach your website.
A standard SEO dashboard may only show that clicks changed. It may not explain why.
Google has introduced generative AI performance reporting in Search Console for AI Overviews and AI Mode, but this is being rolled out progressively and may not be visible for every site immediately. Bing also provides AI Performance reporting that shows how site content is cited in AI-generated answers across supported Microsoft AI experiences.
That is why AI visibility needs a separate reporting layer.
4. Dashboard Build Checklist
Before building the dashboard, define the key reporting blocks.
| Dashboard Element | Data Source | Purpose |
| Query performance | Google Search Console | Tracks clicks, impressions, CTR and average position |
| AI Overview tracking | Search Console / manual tracker | Shows whether key queries trigger AI Overviews |
| Brand mentions | Manual AI prompt tracker | Shows whether your brand appears in AI answers |
| Website citations | Bing Webmaster Tools / manual tracker | Shows whether your pages are used as sources |
| AI referral traffic | GA4 | Shows visits from AI-related platforms |
| Landing page performance | GA4 | Tracks engagement, form submissions and conversions |
| Competitor visibility | Manual tracker | Shows which competitors appear more often |
| Business outcomes | GA4 / CRM | Connects visibility to leads, sales or enquiry quality |
This structure keeps the dashboard focused on the real problem: not just whether people can find you, but whether AI visibility is helping the business.
4.1 Step 1: Connect Google Search Console
Start with Search Console because it shows how your website performs in Google Search.
Track:
- Queries
- Landing pages
- Impressions
- Clicks
- CTR
- Average position
- Country
- Device
Where available, add Google’s generative AI performance data. This can help you review visibility in AI Overviews and AI Mode.
This should not replace standard SEO reporting. It should sit beside it.
For example, if clicks decline but impressions stay stable, AI Overviews may be one possible reason. The dashboard should help your SEO agency, seo consultant or internal team investigate that change properly.
4.2 Step 2: Connect GA4
GA4 shows what happens after someone lands on your website.
Track:
- Sessions
- Engagement rate
- Key events
- Form submissions
- Ecommerce revenue
- Landing pages
- Source and medium
- Conversion rate
GA4 will not show every time someone sees your brand in an AI Overview. It can only show behaviour once users reach the website or return through another measurable channel.
That is why GA4 should be used with Search Console, prompt tracking and citation data.
4.3 Step 3: Add Bing AI Performance Data
Bing AI Performance data can help you understand how your pages are cited across supported Microsoft AI experiences.
Track:
- Cited pages
- Citation trends
- Query themes
- Pages appearing in AI answers
- Topics where competitors may be stronger
This is useful because AI search visibility is not only a Google issue. A digital analytics agency or marketing technology agency may use this alongside Search Console and GA4 to create a wider AI visibility view.
4.4 Step 4: Create a Manual AI Prompt Tracker
Not every AI visibility signal is available through standard connectors. A Google Sheet can fill that gap.
Create columns such as:
| Field | Purpose |
| Date checked | Tracks changes over time |
| Platform | Google, ChatGPT, Perplexity, Gemini or Bing |
| Prompt | The question being tested |
| Brand mentioned | Yes or no |
| Website cited | Yes or no |
| Competitor mentioned | Yes or no |
| Competitor cited | Yes or no |
| Page cited | URL or page name |
| Brand description | Checks whether the answer is accurate |
| Action required | Shows what needs to be improved |
Manual prompt tracking is not perfect. AI answers can change by location, timing, wording and user context. Treat this as a directional visibility signal, not an exact ranking report.
4.5 Step 5: Build the Dashboard Pages
Do not put every chart on one page. Build separate pages based on the questions each team needs to answer.
5. Useful Calculated Field Examples
Calculated fields can make the dashboard easier to use.
For an AI referral source grouping, use logic such as:
Source contains “chatgpt” OR Source contains “perplexity” OR Source contains “gemini” OR Source contains “copilot”
For query type, group keywords like this:
Query contains “how” OR Query contains “what” = Informational
Query contains “agency” OR Query contains “consultant” OR Query contains “services” = Commercial
For AI citation status, use a simple manual field:
Website cited = Yes / No
For action priority, use:
High = Competitor cited and your site not cited
These fields do not need to be complex. They only need to help teams filter the report and make better decisions.
6. Use Blended Data Carefully
Data Studio can blend data, but Search Console and GA4 do not measure the same thing.
Search Console reports search visibility and clicks from Google Search. GA4 reports website sessions and behaviour after users arrive.
The numbers will not always match.
Use blending to compare direction, not to force perfect reconciliation. For example, you can compare Search Console clicks with GA4 sessions, engagement and conversions by landing page.
A digital analytics agency can help structure this properly so the dashboard stays useful and does not overstate accuracy.
7. Add an AI Visibility Scorecard
A scorecard helps make visibility easier to review month to month.
| Metric | Weight |
| Brand mention rate | 25% |
| Website citation rate | 20% |
| Competitor visibility gap | 15% |
| AI referral engagement | 15% |
| Conversion contribution | 15% |
| Brand accuracy | 10% |
The score does not need to be perfect. It gives your team a baseline and helps show whether visibility is improving or declining.
8. Turn Dashboard Findings Into Actions
A good dashboard should not stop at reporting.
| Finding | Possible Issue | Recommended Action |
| Brand missing from key prompts | Weak content or authority | Improve service pages and FAQs |
| Competitor cited often | Competitor content is clearer | Add examples, case studies and comparison content |
| AI referrals have low engagement | Landing page mismatch | Improve page structure and CTA |
| Pages rank but are not cited | Content may not answer clearly | Add direct answers and supporting detail |
| Brand description is inaccurate | Entity signals are unclear | Update About page, schema and external profiles |
This makes the dashboard useful for SEO, content, analytics and CRO teams.
9. Common Mistakes to Avoid
Do not build the dashboard only around traffic. AI search can influence brand discovery even when users do not click immediately.
Do not treat manual prompt tracking as perfect data. It is useful, but it is directional.
Do not combine every AI platform into one metric without context. Google AI Overviews, ChatGPT, Perplexity and Bing do not behave the same way.
Do not ignore conversions. A page with fewer visits but stronger lead quality may still be performing well.
Do not overbuild the first version. Start with Search Console, GA4, manual prompt tracking and Bing data where available. Improve it over time.
10. How a Martech Consulting Team Can Help
Building an AI search visibility dashboard needs SEO, analytics and marketing technology experience.
A martech consulting team or digital analytics agency can help define the data model, connect Search Console and GA4, structure the Data Studio dashboard, create custom fields, set up AI referral tracking and build practical reporting views.
For businesses using Google Marketing Platform, google marketing platform consulting can also help connect AI visibility reporting with paid media, attribution, conversion tracking and wider campaign performance.
The goal is not just to build another dashboard. The goal is to understand how AI search is changing discovery, engagement and conversions.
11. Final Thoughts
AI search visibility is now part of SEO and analytics reporting.
For businesses asking How to build an ai search visibility dashboard in Data Studio, the best starting point is simple: connect Search Console and GA4, add manual AI prompt tracking, include Bing AI Performance data where available, and report visibility alongside business outcomes.
A useful dashboard should track:
- AI Overview presence
- Brand mentions
- Website citations
- Competitor visibility
- AI referral traffic
- Landing page engagement
- Conversions
- Revenue or lead quality
- Content actions
That gives your SEO, analytics and marketing teams a clearer view of how your brand is being discovered in AI search and what needs to improve next.

 Previous